Concept Based Curriculum & Instruction-Prince

The following diagram outlines The Structure of Knowledge framework for what I want the 4-5 year old children to know, understand and be able to do in our Plants as Living Things Unit.

AGE GROUP = 4-5 YEARS
UNIT TIME FRAME = 6 WEEKS

THE THREE DAYS OF LESSONS BELOW IS A “SNAPSHOT” OF A 6 WEEK UNIT WITH THE OVERALL OBJECTIVES OUTLINED ABOVE.

BEFORE :

THIS WILL HELP ASSESS WHAT THE CHILDREN KNOW ABOUT WHAT THEY EAT AND HOW IT GROWS.

DURING LUNCH FOR SEVERAL DAYS LEADING UP TO THE UNIT, THE TEACHER WILL ASK THE CHILDREN QUESTIONS REGARDING WHERE THEY THINK THEIR FOOD COMES FROM TO DETERMINE WHAT PRIOR KNOWLEDGE THE GROUP AND INDIVIDUALS IN THE GROUP POSSESS.
GUIDING QUESTIONS: WHAT FRUITS AND VEGETABLES ARE YOU EATING? DO YOU KNOW WHERE YOUR FOOD COMES FROM? WHAT HAPPENS WITH YOUR FOOD BEFORE IT GETS TO LA CASITA?

DAY 1: SEE-THINK-WONDER STRATEGY
CHILDREN WILL KNOW THAT PLANTS ARE LIVING THINGS.
CHILDREN WILL UNDERSTAND THAT LIVING THINGS GROW AND ARE AFFECTED BY DIFFERENT FACTORS.
CHILDREN WILL BE ABLE TO DRAW A PICTURE TO DEMONSTRATE THEIR KNOWLEDGE AND UNDERSTANDING.

STEP 1: WRITE THE WORD “LIVING THINGS” ON THE BOARD. ASK THE CHILDREN TO CLOSE THEIR EYES AND THINK ABOUT EXAMPLES OF LIVING THINGS. ASK THEM TO PAINT A PICTURE IN THEIR HEAD OF SEVERAL THINGS THAT ARE LIVING BECAUSE THEY ARE GOING TO HAVE A CHANCE TO DRAW THEM.

STEP 2: PLACE A 12X4 LARGE PIECE OF CHART PAPER ACROSS THE WALL OF THE CLASSROOM AND ASK THE CHILDREN TO DRAW THE EXAMPLES OF LIVING THINGS THEY PICTURED IN THEIR HEADS. AS CHILDREN DRAW, ASSIST THEM IN LABELING THEIR DRAWINGS.

STEP 3:ASK THE CHILDREN TO DO A GALLERY WALK (THIS NEEDS TO BE MODELED THROUGHOUT THE YEAR). AS THEY WALK TO VIEW OTHER’S DRAWINGS, THEY SHOULD FIND 1-2 DRAWINGS OF LIVING THINGS THEY HAD NOT THOUGHT ABOUT.

http://www.theteachertoolkit.com/index.php/tool/gallery-walk?wvideo=frn9ji37cn

STEP 4: GATHER THE CHILDREN TOGETHER AND LET THEM KNOW WE ARE GOING TO WATCH A VIDEO AND YOU WANT THEM TO DECIDE WHETHER OR NOT THE VIDEO WE ARE WATCHING SHOWS A LIVING THING OR A NON-LIVING THING AND WE WILL DISCUSS WHY ALONG THE WAY. CHILDREN WILL SHARE OUT LOUD AND TURN AND TALK TO PARTNERS DURING DISCUSSION.

PLAY THE FIRST MINUTE OF THE VIDEO LINKED BELOW. THEN STOP THE VIDEO AND ASK THE QUESTIONS ABOVE TO THE CHILDREN. ASK WHAT DO YOU SEE?

THEN PLAY THE NEXT MINUTE AND STOP AND ASK THE QUESTIONS. ASK IF THERE IS ANYTHING THEY SAW IN THE SECOND SEGMENT THAT WAS DIFFERENT THAN THE FIRST. ASK WHAT DO YOU THINK?

REPEAT UNTIL VIDEO FINISHES. ASK WHAT DO YOU WONDER?

THEN SHOW THE VIDEO AGAIN FROM START TO FINISH WITHOUT STOPPING.

ASSESSMENT: CHILDREN DRAWINGS, DISCUSSIONS, GALLERY WALK

DAY 2: STRATEGY: I USED TO THINK….NOW I THINK…

STEP 1) TELL CHILDREN THAT WE ARE GOING TO GROW FOOD TO EAT. NAME OFF SOME OF THE FOODS YOU’VE OBSERVED THEM BEING INTERESTED IN THAT WE ARE GOING TO GROW. ASK HOW THEY THINK WE GROW FOOD. LEAD A DISCUSSION ON WHAT DO YOU THINK A SEED IS? OPEN DISCUSSION (RECORD WHAT CHILDREN SHARE)
READ ALOUD ERIC CARLE’S THE TINY SEED.

https://www.youtube.com/watch?v=CeIGNOFW6n0

STEP 2) AFTER CONSISTENT MODELING OF THE STRATEGY, USE I USED TO THINK……, NOW I THINK
HAVE CHILDREN DRAW A PICTURE; ON ONE SIDE DRAW WHAT THEY USED TO THINK A SEED WAS AND ON THE OTHER SIDE WHAT THEY NOW KNOW A SEED TO BE.

STEP 3) STUDENTS SHARE ARTWORK AND TEACHER LABELS WHAT THEY SAY ON THEIR ARTWORK.

ASSESSMENT:  USE ARTWORK AND CHILDREN’S VERBAL DESCRIPTIONS.

DAY 3: STRATEGY:3-2-1 Bridge (This should be modeled and practiced many times for it to be effective.)

STEP 1) THE TEACHER WILL GATHER SEEDS FROM THE VARIOUS FOODS CHILDREN EAT AND PUT ON ELMO MACHINE WITH CHILDREN GATHERED AROUND ON THE CARPET.

STEP 2) Using a “Turn and Talk” with a partner. Children will identity a word the seeds make them think of, then share, then other child share word, and keep going until their minds can’t think of any more words. Children will identify a question they have about the seeds and turn and share.Children will identify a metaphor or simile for the seeds.Teacher: Record Observations

3) AFTER DETAILED MODELING BY THE TEACHER, CHILDREN WILL BE SEPARATED INTO GROUPS OF 3, GIVEN A CONTAINER OF VARIOUS SIZE, SHAPE AND COLOR SEEDS AND ASKED TO SORT THEM BY DIFFERENT ATTRIBUTES. THEY WILL RECORD THE QUANTITIES OF THE VARIOUS TYPES OF SEEDS ON A LARGE CHART PAPER GRAPH.

ASSESSMENT: DISCUSSION, TURN AND TALK OBSERVATIONS AND GRAPH SHOWING VARIOUS ATTRIBUTES.

DAY 4: STRATEGY:
STEP 1) TELL CHILDREN WE ARE GOING TO PLANT SEEDS AND OBSERVE THEM OVER TIME RECORDING WHAT WE SEE OVER THE NEXT WEEKS.THEN WE ARE GOING TO EAT THEM FOR LUNCH. ALLOW TIME FOR AWWWS AND OOOHHHHS:)

STEP 2) DEMONSTRATE HOW TO PLANT A SEED AND ASK STUDENTS TO CHOOSE WHICH SEED THEY WANT TO PLANT AND PLANT THE SEEDS IN EGG CARTONS.

STEP 3) TELL CHILDREN SOME OF THE SEEDS WILL GO IN THE WINDOW SILL, SOME WILL GO IN A DARK SPACE WITH NO LIGHT. SOME WILL GO IN A VERY COLD SPACE AND SOME WILL GO IN A VERY WARM SPACE. WE WILL WATER SOME OF THE SEEDS A LITTLE AND SOME OF THE SEEDS WILL HAVE LOTS OF WATER. THEN WE ARE GOING TO DISCOVER WHETHER HAVING LIGHT, A CERTAIN TEMPERATURE AND CERTAIN AMOUNT OF WATER SEEMS TO AFFECT THE GROWTH OF THE PLANTS. HAVE THE CHILDREN HELP TO DETERMINE WHO PUTS THEIR SEEDS WHERE AND THEN PLACE THEM IN THE DESIGNATED SPOTS.

STEP 4) TALK WITH THE CHILDREN ABOUT WHAT BEING A SCIENTIST MEANS AND PREPARE OBSERVATION NOTEBOOKS AND SCIENTIST LAB COATS FOR DAILY OBSERVATIONS.

ASSESSMENT: DISCUSSION, SEED/EGG CARTON, NOTEBOOK READY
 
AFTER:
CHILDREN WILL RECORD DAILY OBSERVATIONS, AND USING OTHER MTV STRATEGIES THROUGHOUT THE UNIT, ALONG WITH THE UNIT CONCEPTS AND LEARNING STANDARDS, EXPLORE THE LIFE CYCLE OF PLANTS, MAKING PREDICTIONS, OBSERVATIONS AND AND REPRESENTATIONS OF THEIR LEARNING ALONG THE WAY. CHILDREN WILL DESIGN A GARDEN AND PLANT THIER SEEDLINGS IN THE GARDEN CONTINUING THEIR OBSERVATIONS OUTSIDE. THE CULMINATING LESSON WILL BE AN INVITATION TO OUR PARENTS AND FAMILIES FOR LUNCH (THIS WILL NEED TO OCCUR WHEN THE FOOD IS READY FOR PICKING WHICH WILL MOST LIKELY BE BEYOND THE 6 WEEK UNIT TIMEFRAME). OUR CHILDREN WILL PREPARE AND SERVE THEIR FAMILIES LUNCH FROM THE GARDEN.


Posted in Concept-Based | Tagged , , , , , | 14 Comments

CBCI Strategy – Burtis

The following blog reflects a big departure from how I have done things in the past! Maybe old dogs can learn new tricks. After going through the readings for class, I was compelled to look at how I go about teaching. The Foxtrot cartoon below the web really struck a chord. So these lessons start with word problems. Those are usually left for the end, and students dread them. I figure by making them part of the discovery problem, maybe the connection between the math and its applications might be easier to see. If it demystifies word problems and helps the students to understand their value, that’s even better. Every topic in the entire chapter utilizes word problems, so it can be extended to the entire chapter, not just this snippet of it. The other thing I decided was to stress simplifying. In fact, the original draft of the unit web below had “Simplifying Systems of Equations” at it’s center. Isn’t that how we achieve the initial goal of  “turning two equations with two variables into one equation with one variable”? Isn’t solving for a variable just simplifying an equation by isolating the variable? Until we get to 3 x 3 equations and introduce matrix solutions, every other process we utilize in this chapter is already firmly in their tool box, they just need to use them a bit differently…

Applying CBCI to Chapter on Systems of Equations 

The overall unit on Systems of equations has 6 sections and is mapped out at 13-14 days. We break it into 3 smaller units. The first, the one described in this post, covers two equations in two variables and should be about 5 to 6 days.  A section on Linear Programming comes next and is then followed by 3 x 3 systems. Below is a web of the first unit using the first 4 steps from the text. The CBCI components for the two proposed lesson plans to accompany this unit, generalizations, guiding questions, critical content, and key skills, are spelled out in the lesson plans themselves. The web was provided as an overall look at the section.

Recommended Pacing:

  • Day 1 – Introduction, graphing, tables
  • Day 2 – Substitution
  • Day 3 – Elimination
  • Day 4 – Systems without unique solutions
  • Day 5 – Inequalities

This cartoon is an illustration of the disconnect between the math and its application that a lot of student experience, most without realizing it!


CBCI Lesson Plan #1 – Burtis

Unit Title: Solving Systems of Equations                 Instructor: Chris Burtis

Subject: Algebra 2                                                          Grade Level: 11 & 12

Lesson Number: 1                                                       Lesson Time Frame: 1 class period

Lesson Opening:

Many situations in the real world involve more than one variable and more than one equation. These functions can be represented in multiple ways. In this unit, we are going to look at how we can solve these systems of equations by using existing knowledge and some creative simplifying. You have the tools, we will look at a slightly different way to use them.

In this opening lesson, we are going to focus on a graphing approach to finding the solutions to a system of equations. We will answer the question: “what is the solution to a system of equations?”.  We will discover the types of answers that are possible, and along the way find a second way to find the solution. At the end of the lesson you will be able to solve a system of equations in two variables by graphing and by using a table. You will also be able to classify a system.

Generalizations:

Students will understand that…

A)  To solve a system of equation, find a set of values that replace the variables and make each equation true.

            Guided Questions for A:

  1. What is the relationship between the variables and the solution in a single two-variable equation?
  2. Does that same relationship apply to systems of two equations?

B)  A point of intersection of the graphs of the functions is the solution of the system.

           Guided Questions for B:

  1. How can you use a graph to solve a system of linear equations?
  2. Will the numbers and types of solutions vary?

C)  If graphing by using a table, you may be able to find the solution without creating the graph.

         Guided Questions for C:

  1. When making an xy-table, what is the goal?
  2. How is it possible to find the solution from the table?


Materials/Resources:

  • Word problem examples to project on the board for discussion and discovery at each step.
  • White board to record student thinking.
  • Homework handout. (A mix of straight problems and a few word problems)

Assessments:

  1. Formative assessment: Observe student’s participation in group and class discussion.
  2. A homework assignment where the students will use their newly developed skills to solve by graphing and by using a table.
  3. There will be a unit quiz and then a chapter test where these skills will be assessed.

In-Class Process:

Put the students in groups to start.

  1. Use a whole-class Chalk Talk (adapted to them giving the teacher words or ideas they recall) to guide discussion of systems of linear equations (this is NOT a new concept, as it was discussed in Algebra 1). Then ask the groups to discuss the first two guided questions, jotting down their thoughts. After 2-3 minutes, bring to whole class discussion to have them share out their thoughts, culminating in the concept of the solution.
  2. Project the first word problem on the board (for concept B). In their small groups, take 5 minutes to answer the second set of two guided questions. The whole class discussion will need to include the information of classifications.  Hopefully they will recognize the special cases, teacher just needs to provide the name for the classifications. If this came up in the Chalk Talk, great. After discussing their thinking, solve the problem on the board in whole class.
  3. Project the second word problem on the board (for concept C). This time, in their groups, ask them to consider the last two guided question, and then to create tables in anticipation of graphing, but not to graph. Bring back together and share out their thoughts, which hopefully leads to them finding the point of intersection by identifying matching ordered pairs between the two tables.
  4. Put a system of equations on the board (this can be without a word problem) and ask the groups to solve the problem. It is one that does not have an integer answer, so exact answers by graph or table will not be possible…The discussion then leads them to the fact that in the next lesson they will start looking at algebraic solutions.
  5. Homework will be 9 problems, 5 asking them to solve by graphing and 3 by table. (Make at least 3 of them word problems.) The last question will be a short answer question asking:”Can you think of a way to classify the system without graphing or making a table?”.

 WORD PROBLEM FOR B. (#2)

You can choose between two tennis courts at two city parks to play tennis. One park charges $4 per hour. The other park charges $2 per hour plus a one-time fee of $4. How many hours must you play for the cost to be the same?

 WORD PROBLEM FOR C. (#3)

There are 25 bikes and trikes at the park. The bikes and trikes have 60 wheels in all. How many bikes and trikes are in the park?

SYSTEM FOR PART 4

Teacher notes: Depending on the level of your students, the process of turning the word problem into equations can be included in the groups, or can be done whole class before groups start talking. They will have had plenty of practice doing this skill in chapters 1 and 2, so just depends on where you want them to spend their time. The same applies to converting from standard form to slope-intercept. If you feel your students need more practice on either or both of those skills, break the lesson into 2 parts! Section 1 should be quick, since this is a review of Algebra 1 topic, so groups there is optional. In Section 2, depending on recall from Algebra 1 and who their teacher was, they may already be familiar with the classifications, and simply asking them to define the terms may suffice. Section 4 has another option. If teaching a college prep or honors class, teacher can ask the groups to create a system that is not solvable by graphing or tables. I do not teach either of those, so I chose to give them a problem and have them determine why it can’t be solved via the two options we talked about.  If time becomes an issue, start day 2 with #4, since it is the segue to algebraic methods anyway. As a suggestion, before moving into group phase I would project the guided question up on the board so they can refer to it easily.

Below are links for anyone needing more examples of solving by graphing:

https://www.youtube.com/watch?v=T1-yEF6ZBGA

https://www.youtube.com/watch?v=iMyowM_cPww

https://www.youtube.com/watch?v=AVm3eAVGi7M

These are links to explain the classification of systems:

https://www.youtube.com/watch?v=wtLGDhVoxvs

https://www.youtube.com/watch?v=x70Id8sIDL0

Here is a link to solve by using tables:

https://www.youtube.com/watch?v=BtNWyGSYEX0

CBCI Lesson Plan #2 – Burtis

Unit Title: Solving Systems of Equations                Instructor: Chris Burtis

Subject: Algebra 2                                                         Grade Level: 11 & 12

Lesson Number: 3                                                       Lesson Time Frame: 1 class period

Lesson Opening:

We have now discovered three methods for serving systems of equation; graphing, using tables, and substitution. The substitution method was our first algebraic version. To work, the systems needed at least one equation already solved for x or y, or an equation that could easily be converted. We are not always that lucky, so we need an algebraic Plan B. Today we are going to learn about the elimination method.

Generalizations:

Students will understand that…

A)  A system with both equations in standard form and having matching coefficients on either variable can be solved using elimination.

Guided Questions:

  1. What was our major goal with our first step in substitution?
  2. Can you accomplish the same goal with these equations?
  3. Is there any similarity in this method and substitution?

B)  An equivalent system can be used to solve a system with two equations in standard form but without any matching variables.

Guided Questions:

  1. Is there a way to make corresponding coefficients match?
  2. How will you perform the last step in this case?

For Problem #3, still the same concept

  1. How can I get corresponding coefficients?
  2. Is there more than one way to do this problem?


Materials/Resources:

  • Word problem examples to project on the board for discussion and discovery at each step.
  • White board to record student thinking.
  • Homework handout. (A mix of direct problems and word problems)

Assessments:

  1. Formative assessment: Observe student’s participation in group and class discussion.
  2. A homework assignment where the students will use their newly developed skills to solve by elimination.
  3. There will be a unit quiz and then a chapter test, where these skills will be covered.
  4. Whole class discussion of Headlines created by the groups.
  5. Possible Extension: Start class on Day 5 asking the students to take 15-20 minutes and answer the question “Compare and Contrast Substitution and Elimination”

In-Class Process:

Put the students in groups to start.

  1. Project the first word problem on the board (for concept A). In group, discuss what is different from yesterday (substitution) and pose the first three Guided questions. After 5-10 minutes, (Teacher can determine time as he/she wanders the room) Back to whole class to share thoughts and ideas. Use whole class to share solution
  2. Project the second problem on the board (for concept B). In their small groups, take 5 minutes to answer the second set of two guided questions. Back to whole class to share out. After discussing their thinking, solve the problem on the board in whole class.
  3. Project the third word problem on the board (extension of B). This time, in their groups, ask them to consider the last two guided question. Small group for 5 minutes and then back to whole class to share thinking. Solve in whole class scenario
  4. Wrap-up the lesson by having the students, in groups, write a Headline about what they learned in class.
  5. Homework will be 10 problems, 4 with matching coefficients, 3 needing one equation multiplied, and 3 needing both equations multiplied. I would make at least 4 of them word problems.

Word Problem for A. (#1)

The senior class at HHS and BHS planned trips to a Reds game. HHS filled 7 vans and 5 buses with 171 students. BHS filled 12 vans and 5 buses with 211 students. Each van and each bus carried the same number of student. How many students can a van carry? How many students can a bus carry?  

Word Problem for B. (#2)

A student took 60 minutes to answer 20 questions on a test. There were multiple-choice questions and extended-response questions. She took 2 minutes to answer each multiple-choice question and 6 minutes to answer each extended-response question. How many of each type of question were there?

Word Problem for C. (#3)

The school that Michael attends is selling tickets to a play. On the first day of ticket sales, the school sold 7 adult tickets and 6 student tickets for a total of $111. The school took in $146 on the second day by selling 10 adult tickets and 7 student tickets. What is the price each of one adult ticket and one student ticket?

Teacher notes: Depending on the level of your students, the process of turning the word problem into equations can be included in the groups, or can be done whole class before groups start talking. They will have had plenty of practice doing this skill in chapters 1 and 2, so just depends on where you want them to spend their time.  The Headlines exercise in #4 depends on time availability and if you have used the Headline thinking routine and students are familiar with it. If no time, an exit ticket is always an option, and the Headline routine can be backed up to start the next class with. The Possible Extension is a direct result of our district initiative to try to improve student’s writing skills. We are required to submit them monthly and this is a nice opportunity to work it into the flow of the unit.

Below are links for solving using Elimination:

https://www.youtube.com/watch?v=z1hz8-Kri1E&spfreload=10   (subtract)

https://www.youtube.com/watch?v=lQEmOB_QzZA  (multiply one)

https://www.youtube.com/watch?v=BqfWgF4nOko  (multiply both)

Posted in Concept-Based, Misc | Tagged , , , | 10 Comments

CBCI Lesson Plan – Heller

Unit Title: Linear Relationships: What will happen next?

Subject: Algebra I 
Lesson Opening: You’ve already learned all of the building blocks of linear functions. We’ve worked with at least three different ways to represent linear relationships and have a strong understanding of how each of those relationships work together. Now we’re going to use all of that information to make predictions based on linear patterns. If you know what happens in one day, can you use that to predict what will happen in a week, a month, a year? When patterns are linear, they are consistent. Therefore we can use what we know to predict the future.  In this unit, we will be looking at situations and data that may or may not have linear  behavior. It will be up to you to analyze the data and determine what is happening in a situation based on the mathematics you observe. By the end of the unit, you will be able to identify if there are linear relationships with a data set and how to use linear relationships to predict what would happen in the future.

Learning Targets:

  1. Students will understand how to identify linear relationships from data

Guiding Questions:

  • What makes a relationship linear? (F)
  • How can a linear relationship be represented? (F)
  • Where are the slope and y-intercept represented in the data? (C)

2. Students will understand ways to use linear relationships to predict future occurrences.

Guiding Questions:

  • How can this relationship be used to predict what happens next? (C)
  • Does that hold true for all future occurrences? (D)
  • How can you be sure? (D)

Strand: 

Expressing Linear Functions with Representations: 

Critical Content (know): definition of slope, y-intercept, x-intercept, and coordinates on the plane

Key Skills (Able To Do): Identify slope and y-intercept from data, can represent data in various forms (graphs, tables, etc) and can generalize data using an equation in any linear form.

Use Linear Models to Predict Future Occurrences:

Critical Content (Know): standard form, slope intercept form and point slope form of linear functions

Key Skills (Able To Do): Analyze data to determine linear relationships, create linear models from data, extend linear models past given data (future predictions)

Lesson Objective: Students know that linear relationships can be expressed using a table, graph, equation and are familiar with verbal descriptions of all three representations. This unit will extend that knowledge such that students will be able to identify a relationship as linear, represent it in a variety of ways and use those representations to make future predictions.

Learning Experience One:

Lesson Timing: This task is designed for three 45 minute class periods. The first class period will be allotted for introducing the unit, small group work with the task and beginning the first discussion over what students observed. The second class period will be provide time for students to finish the first discussion and begin the second part of the activity. The third class period will provide time for students to share their questions and solutions and look for other possible pathways to solve the questions posed.

Standards:

CCSS.MATH.CONTENT.HSA.CED.A1: I CAN create equations in one variable and use them to solve problems

CCSS.MATH.CONTENT.HSA.CED.A.3: I CAN represent restrains of equations and determine if solutions are valid for those restrains.

CCSS.MATH.CONTENT.HSF.LE.A.1 I CAN identify situations that can be represented by linear functions

CCSS.MATH.CONTENT.HSF.LE.A.1.A: I CAN prove that linear functions grow by equal differences.

Learning Experience:

Students will be given the following scenario after the unit has been introduced:

Scenario (Day 1):

You are working as a lifeguard at a pool over the summer. At the beginning of the summer, you have to fill the pools with water. When you get to work, you notice that someone forgot to drain the pool from last summer. You now have to fill the empty pool with water and drain the full pool so that you can put in fresh water for the summer. Each pool holds 600 gallons of water. Luckily, a fellow lifeguard arrived earlier and began to fill the empty pool, but only filled the pool with 150 gallons of water. You start to drain and fill the two pools respectively at the time time. 2 hours later, you check both of the pools. The pool that started with 150 gallons of water now has  250 gallons of water. The pool that started with 600 gallons of water now has 500 gallons of water. 3 hours later, you check the pools again and the pool that is filling now has 400 gallons of water and the pool that is draining now has 350 gallons of water.

With your group, examine the scenario and answer the following:

  1. What questions do you have about the scenario?
  2. What types of inferences do you think you can draw from the scenario?
  3. Can you make any mathematical observations from the information given?
  4. If you could have more information, what information would you like and why.

Record your findings, questions and ideas in a way that makes sense to you and your group.

Discussion(Day 1 – Day 2):

To begin the discussion, each group will get a large post it paper and write down their questions, observations and representations. Each of these will be put up in the front of the class to display each group’s thought process. Students will have a few moments to read through the other group’s findings. As a class, there will be a discussion that follows about the inferences students made, what mathematical observations they recorded, the questions that they had and the extra information they wanted but did not have.

After the discussion, the students are asked (Day 2 – Day 3):

What would some logical questions be to this scenario and how could you solve them?

With their groups, students will formulate possible questions (ie: When will the pools have the same amount of water? How long will it take to fill the pool? How long will it take to drain the pool? If the pools were smaller or larger, how would that affect the time it takes to fill and drain the pools? etc.) and solutions to their questions.

Discussion 2 (Day 3):

Students will present their questions and solutions to the class and a  second discussion will follow regarding the questions students formulated and if there are other possible questions and/or ways to solve the questions posed.

Differentiation: For students working at varying levels within the same classroom, groups can be created as heterogenous groups so that there is a high achieving student, average achieving student and low achieving student within the same group. This will allow for all students to see various perspectives on the scenario based on different observations and background knowledge. Students who receive accommodations per IEPs or 504 plans will be granted those accommodations.

Assessment: Students will be formatively assessed based on their group work, participation in discussions and ability to connect the data to the idea of linearity and at least one linear representation. Students will be provided a rubric that outlines the expectations for participation and mathematical connections.

Materials:

  • Scenario
  • Large post-it paper
  • Markers to record on post-it paper
  • Graph paper if students would like to use it for representations

Teacher Notes: For this lesson it will be tempting to jump in and lead students to the idea of comparing the amount of water and the amount of time. Refrain from guiding students too much through the activity including pointing to various representations of linear functions (graphs, tables, equations, etc). Allow students to investigate the scenario on their own to make genuine connections to the mathematical concepts being examined.
Learning Experience Two: 

Lesson Objective: For this lesson, students will continually be building on their knowledge of linear functions. Students will be researching and analyzing data to find linear relationships between variables in a way that can be used to make future predictions. Students will be extending their knowledge by asking questions that can be answered via data analysis and by making predictions based on the data.

Lesson Timing: This task is designed for two 45 minute class periods. The first class period will be allotted for student research on data and discussion within the small group to analyze the data. The second class period will be allowing students to present their data and get feedback from their peers as outlined in the lesson outline.

Standards:

CCSS.MATH.CONTENT.HSA.REI.B.3: I CAN solve linear equations with variable coefficients.

CCSS.MATH.CONTENT.HSA.CED.A.1: I CAN create equations in one variable and use them to solve problems

CCSS.MATH.PRACTICE.MP3: I CAN make arguments from data and analyze the claims of others. 

Learning Experience:

Prompt(Day 1): As you reflect on daily occurrences that surround you, ideas that interest you or activities you participate in, ask yourself, “Do the variables that make up this circumstance have a linear relationship?”

This may not be obvious at first and that is okay!

With your group, brainstorm possible situations that have variables with linear relationships. Once your group has decided on a situation, research that situation to find data on the variables you have chosen. Analyze the data you have found and determine if a linear relationship exists. As you analyze the data, look for other mathematical patterns as well and think about the following questions:

  1. What types of inferences do you think you can draw from the data you have collected?
  2. Are there other mathematical patterns within the data? Can you model those patterns? What types of relationships do these patterns show?
  3. If you could have more information, what information would you like and why.
  4. What mathematical questions can you formulate that you might use this data to answer?

Example: Brody and Joey love basketball and are interested in the average height of basketball players over the years as they dream to play in the NBA one day. They decide that they want to analyze data that includes the average height and weight for NBA players since 1951. Brody and Joey collect the following data:
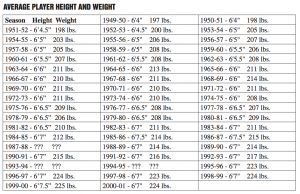
The boys will now analyze this data and create mathematical questions that may be solved from the data.

Discussion(Day 2):

Each group will present their findings to the class. The class will discuss the findings and questions for that group in terms of what they found interesting, if anyone sees additional patterns, what other data could have supported their claim, etc. After each group has presented their data, the other groups will be given a few moments (5-10) to design a question they would want to try to answer based on the presented data. These questions can be as broad or as narrow as students choose to cover content knowledge (writing an equation) as well as extending their knowledge (looking for other patterns or influences in the data). Students will submit their groups questions at the end of the class period

Differentiation: Students will be in heterogenous groups that have mixed interests and ability levels. This is to ensure that students are exposed to varying mathematical ideas and levels both in and outside of the classroom. Students who need guided instruction will be given specific scenarios that have linear relationships, but will remain in charge of finding data, interpreting the data and arriving at the conclusion that the data shows a linear relationship. Students who receive accommodations per IEPs or 504 plans will be granted those accommodations.

Assessment: The questions that students created from their peer’s presentations will be used as assessment questions as there will be multiple different outlooks on linear relationships. Students will be given 2 – 3 questions and the supporting data to assess if they achieved the goal of understanding how to identify linear relationships from data and ways to use linear relationships to predict future occurrences.

Post Lesson: After the lesson, this video can be used to give students more examples of linear relationships and their connections to prior knowledge. Into to Linear Functions

Materials:

  • Computer access for data research
  • Paper and writing utensil to record student data, questions, observations, etc
  • Graph paper if students choose to represent their data graphically

Teacher Notes: This is a very open activity with many opportunities for students to make strong educational choices. While it may be difficult not to give specific parameters, it is important to let students make the choices about what data is important to collect and analyze. A great deal of the understanding in this unit is to choose variables that may have linear relationships. If students are choosing variables that clearly will not have linear relationships, this should act as a red flag and the teacher can intervene with questions about what it means to be linear and have linear relationships without directing students to specific data or scenarios.


While working through the CBCI unit, I found it much more in depth than the MTV section. This website helped me reason though some of the ideas behind CBCI and has some interesting posts.

Posted in Concept-Based | Tagged , , , , , , , , , , , | 15 Comments

Walters-Concept Based Unit

Unit Title:  Stretching and Shrinking (title from CMP3 curriculum)

Conceptual Lens:  Relationships and Change

Unit Strands:  Perimeter and Scale Factor, Area and Scale Factor

Web out Unit’s topics and concepts:

Generalizations:

  • The scale factor of a polygon has a relationship towards how the perimeter and area of the new figure changes.
  • Scale factor is how much larger or smaller a figure is getting in all dimensions.
  • The perimeter change will be the scale factor
  • The area change will be the scale factor squared
  • The changes of perimeter and area only apply if the 2 figures are similar.

Develop the guiding questions

  • How do you find the area of a polygon? (F)
  • How do you find the perimeter of a polygon? (F)
  • How do you find scale factor? (C)
  • How do you see the perimeter is affected by a scale factor? (C)
  • How do you see the area is affected by the scale factor? (C)
  • What would happen if you are looking at volume changes with a scale factor? (D)

Identify the Critical Content

  • Perimeter is the outside distance around a figure
  • Area is the inside space of a figure
  • Scale factor affects all dimensions of a figure and is the number I multiplied each of the sides of the original figure to get to my new figure
  • Similar shapes have a scale factor, same angles and same shape.

Identify the Key Skills

  • How to calculate area and perimeter
  • How to build a figure based on a certain scale factor
  • Using multiplication and division skills to find a pattern
  • Be familiar with and be able to calculate problems involving an exponent of 2

Standards:

7.RP.2:  Recognize and represent proportional relationships between quantities.

7.RP.3:  Use proportional relationships to solve multistep ratio and percent problems. Examples: simple interest, tax, markups and markdowns, gratuities and commissions, fees, percent increase and decrease, percent error.

  7.G.1:  Solve problems involving scale drawings of geometric figures, including computing actual lengths and areas from a scale drawing and reproducing a scale drawing at a different scale.

7.G.2:  Draw (freehand, with ruler and protractor, and with technology) geometric shapes with given conditions. Focus on constructing triangles from three measures of angles or sides, noticing when the conditions determine a unique triangle, more than one triangle, or no triangle.

Day 1:  

  • Students will watch this you tube video to refresh their thinking on scale factor before we begin our activity:

https://www.youtube.com/watch?v=8HNsG6qhl60

  • Students are given centimeter cubes in their groups and a piece of white paper.  They are to create a rectangle of any number of cubes long (from 4-20) and any number of cubes wide (from 4-20).

  • Using a ruler, they draw their created rectangle and remove the cubes.
  • Each group is given a die and they will roll to see what scale factor they will have to draw of their figure (excluding 1).  
  • Using the centimeter cubes, they will create their new rectangle based on the scale factor. Then, they will draw the new rectangle on their paper.
  • They will find the area and perimeter of each rectangle and write down those answers on a new piece of paper
  • All the student groups will then hang up their work around the classroom and we will do a gallery walk where they have to go look at 3 other groups work.  As they are walking around they need to write down their original area and perimeters, the scale factor, and the new areas and perimeters while trying to come up with a pattern.
  • At the end of the day, students will write down their predictions after day 1 as to how scale factor affects area and perimeter changes.  It could be helpful to ask the question, “How could I get from the original perimeter to the new perimeter?”

Day 2

  • The day will begin with students bringing out their observations from yesterday and looking over them to see what their predictions are so far with scale factor relationships.
  • Students today will be using a program on phet.colorado.edu to compare perimeter and area of similar shapes.

  • They will begin by starting with a non-traditional shape (no squares, rectangles, etc.) and the computer will calculate the area and perimeter for them. I tell students to think about Tetris pieces if they are stuck with what shape to make. 

  • Then, they will have to recreate their original picture with a scale factor of 2.  
  • They will do the same for scale factor of 3.  Without the program they will try to do the same activity on paper for a scale factor of 4.  
  • At the end of this lesson, students will again write down their observations and predictions for what they see happening.  As a teacher I would ask the question, how do you see the scale factor changing the perimeter?  the area?

Day 3

  • Students will get into their groups and each will share their predictions from the past two days of how scale factor relates to area and perimeter.
  • They will then use the MTV strategy of headlines and create a headline for what they believe is happening.
  • We will discuss the headlines as a class, making observations and establish as a group what is happening.
  • I would then have us get out white boards and practice this concept as well as doing some practice at our seat to get them ready for the assessment day tomorrow

Day 4:  Assessment Day

Assessment and scoring guide/rubric

What:  Investigate the relationship with scale factor affecting changes in area and perimeter

Why: In order to understand that the scale factor times perimeter will give me my new perimeter among similar figures and the scale factor squared times area will give my new area among similar figures.

How:  In our textbook that we use, we introduce the “Wump Family” to teach the students about similar figures.  This is not in our textbook but I bring the Wump Family back through the sad new of a murder.  I have the classroom marked up like a crime scene and tape a “dead” Wump cartoon character on the floor.  Students are given a scale drawing of the murdered Wump.  

They are then given a list of clues of who killed him.  Clues

It is their job as detectives to draw to scale the murderer based on the clues.  All of the clues deal with scale factors of the “dead” wump.  Some questions are phrased as changes in perimeter and some are asking about changes in area.  When they are completed with their drawing, they will turn it in for me to grade.  Here is the grading rubric that their grade will be based on:

Correct Body ___/3

Correct Hat ___/3

Correct Legs ___/3

Correct Arms ___/3

Correct Face ___/3

TOTAL ___/15

Unit overview

What happens to the perimeter when a similar figure is double in size? What happens to the area when the similar figure is scaled down?  Who killed Mug Wump?  All of these questions will be answered and more as we jump into our new unit of Stretching and Shrinking. Through this unit, we will be looking at the relationship scale factor has on both area and perimeter of a similar figure.  So get ready to explore and become detectives on this great mystery we are about ready to embark on.

Posted in Concept-Based | 29 Comments

Hickman- CBCI

Unit Title- Succeeding in the 21st Century: What does it mean to earn a degree?

Conceptual Lens- Options

Unit Strands- Exposure, Redefining, Narrowing Down

Unit Web- This unit, focusing on degrees and the 21st century employee, will fall as an introduction unit to a year long unit which covers many other topics such as; financial aid and the FAFSA, how to apply to college, how to handle unexpected setbacks, choosing a degree and the college orientation process.

Generalizations-

  • There are many options when considering higher education
  • Changing technology, historical events and values shape the type of employee employers are looking for
  • Government decisions have an impact on higher education

Guided Questions-

  • How many degrees does Miami offer? (F)
  • Will a focus on technical programs increase over time? (D)
  • How do historical events shape the needs of a company? (C)
  • How many colleges are within an hour from where we live? (F)
  • Is it worth it to earn a degree that may not result in a job in that specific field? (D)
  • What are the ways in which government decisions have impacted higher education? (C)

Critical content-

  • The differences between Certificates, Associate’s Degrees, Bachelor’s Degrees, Master’s Degrees, and Doctoral Degrees
  • Requirements for the Miami Plan or foundation courses
  • Degrees offered through Miami

Identify critical skills-

  • Use decision-making skills to determine which option is best for yourself
  • Formulate questions and search for answers on college and business websites

Assessment-

What- Investigate degrees and higher education options and the ways in which these routes move into todays current job market.

Why- In order to determine what the best option is for each individual and understand that changing technology, historical events and values shape the type of employee employers are looking for.

How (Engaging Scenario)- Playing the Major Decisions Game

Learning Experiences-

Succeeding in the 21st Century: What does it mean to earn a degree?

9th-12th grade students


Lesson 1: Types of Higher Education

  • Day 1
  • (5 minutes) Unit overview
  • (5 minutes) pose the questions, Why do we go to school? Why do we get jobs? Discuss survival of society. Prepare students to be critical when it comes to thinking about school and jobs so not to be easily manipulated.
  • (10 minutes) First part of YOUniversity presentation- introducing students to education options, admission requirements, characteristics of each option ex cost etc.
  • (sample)
  • Day 2
    • (20 minutes) Major Decision Game (already created)- I will ask students a series of 10 would you rather questions. Each questions has six options. Depending on the option they choose, students will go to the side of the room with the correlating color on the wall. Each question explores the student’s personality to determine majors that they may be interested in. (10 minutes reading the questions and moving in the room, 10 minutes sitting down and exploring the results, which majors fit each color)
    • (sample)
      • (2 minutes) Discuss how majors change based on our changing culture
      • (3 minutes) Discuss reasons why these changes happened?
      • (5 minutes) Students will expand their creative thinking by spending 5 minutes brainstorming and coming up with at least one brand new degree program that does not exist and two reasons why this innovative degree would be valuable? What skills would you gain, where would you work etc. Have students write the name of their degree and a quick description on a colored piece of paper. 
      • (5 minutes) Students will volunteer to share the degree they have created and why
      • (5 minutes) After sharing their ideas, students will spend 5 minutes on their laptop searching the internet to see if their program actually exists anywhere. Students will be encouraged to discuss their findings as they come about.
      • (10 minutes) Have students share what they have found. Discuss what the benefits could be for students who take these courses compared to students who don’t? Guide students to understanding what it means to be a well rounded student. These students have an understanding of cultures, art, languages, history etc.
      • (5 minutes) Read article about steel industry changing

http://www.ohiosteel.org/ohio-steel-industry/history/

https://www.forbes.com/sites/martinzwilling/2013/12/25/a-new-era-for-entrepreneurs-and-startups-has-begun/#63e6455c4bd1

      • (5 minutes) Read article about current start up companies

Day 3

  • (3 minutes) Introduction: Have the creative degrees and descriptions hanging in the room. Review what was talked about the day before regarding degree programs, changing companies and cultures and their innovative degrees
  • (5 minutes) Students will spend 5 minutes writing down as many reasons why some students are “good at school”?
  • (2 minutes) Share ideas
  • (30 minutes) Split students into groups of four. Have each group look at different college websites to find out what their liberal education foundation requirements are. Give each student group instructions on how to find the course list and course descriptions. Have them jot down a few of the most interesting foundation courses students may take and what they learn in those courses.
  • Day 4
  • (3 minutes) Intro, remind students what was talked about the previous two days
  • (30 minutes) have students split into same four groups. Have each group explore a different type of career on a job search engine. Write down job title, degree requirement and the types of tasks each job requires.
        • https://www.monster.com/, http://www.careerbuilder.com/, https://www.indeed.com/
          • (5 minutes) have each group share what they found
          • (5 minutes) discuss together the importance of major choice, foundational knowledge (foundation courses) Pose the question, “how else could a person gain the qualities necessary to be successful in today’s workforce?” ex- being involved in an organization, playing sports, having a job young, etc.
          • (2 minutes) Wrap up

Day 5

  • Flexible time to use if lessons run over
  • Students will spend the remainder of class working on their Next-Steps Path
  • (sample) Actual Next-Steps Path would include topics such as;
    • Determine money available
      • visit FAFSA.gov, talked to family about whether or not there will be help from them for your higher education, research scholarship websites, research tuition costs
    • Look into the courses you have taken and grades you will have earned by the end of high school
    • Research admission requirements for different options
    • Research application deadlines
    • Look up career assessment tests in order to choose a major/career path
    • Look up additional careers on websites and what their requirements are
  • (Next-Steps Path will also include shortcuts or alternate routes indicating that many steps do not need to be completed in any particular order.


Posted in Misc | 24 Comments

CBCI – Frydryk

Unit Title:  Trig Functions:  Circles, Triangles, and Graphs – Oh My!
Conceptual lens: relationships
Unit strands: radians, unit circle, graphing sine & cosine
Topics & concepts:
– Radians – radian, circle, arc length, pi, radius
– Unit circle – radius = 1, right triangles
– Graphs – right triangles, unit circle, sine, cosine, (amplitude, frequency, period, translations?)
Generalizations and Guiding Questions:
– UNIT:  The graphs of sine and cosine, measured in radians, are generated from special right triangles drawn in the unit circle.
– LESSON 1:  Radians measure angles by relating the radius of a circle to the arc length of a central angle.
What do radians measure?
How do radians relate to the circumference formula?
How are radians related to circles?
– LESSON 1:  An angle that measures one radian has an arc length of one radius.
What is a radian?
How many radians is 180°? (or any other angle measure)
Is it better to use radians or degrees to measure angles?  Why?
– LESSON 2:  Special right triangles (30-60-90 and 45-45-90) with hypotenuse length 1 can be used with the unit circle to represent various central angle measures around the circle.
How can a 30-60-90 triangle be used to represent a 210° = 7π/6 angle? (or any other angle measure)
– LESSON 2:  Special right triangles in the unit circle give the (x,y) coordinate points of f(x) = sin x and f(x) = cos x, where x corresponds to the central angle and y corresponds to the sine or cosine value of that angle.
What are sine and cosine?
How does the unit circle help us understand the graphs of f(x) = sin x and f(x) = cos x?
How do triangles help us understand the graphs of f(x) = sin x and f(x) = cos x?
Critical content:
– LESSON 1:  definitions of radian and arc length, formula for the circumference of a circle
– LESSON 2:  unit circle values (sine, cosine, tangent of various angles), identify the graphs of sine and cosine
Key skills:
– LESSON 1:  calculate radian measure of an angle, convert angles from degrees to radians and vice versa
– LESSON 2:  geometrically portray the sine or cosine value of any angle on the unit circle. accurately sketch the graphs of sine and cosine.
Culminating assessment:  sample questions include:
– LESSON 1:  Geometrically portray, and explain in writing, why 210° = 7π/6
– LESSON 2:  Geometrically portray, and explain in writing, why sin (7π/4) = -√(2)/2
Suggested learning experiences: 2 outlined below are Radian Strings and Spaghetti Graphs
Unit overview:  Circles, triangles, and graphs are three seemingly unrelated mathematical ideas, yet they are intricately related once trigonometry is introduced.  In this unit we will explore the relationships between circles, triangles, and graphs of trigonometric functions.

Radian Strings
Overview:  In this lesson, students will look at how radian measure works/where it comes from, using a hands-on activity.Prior Knowledge Needed/When to Teach:  Students should be familiar with:  measuring the radius of a circle, the value pi
Timing: 1-2 days
Standards:
F-TF.A.1  Understand radian measure of an angle as the length of the arc on the unit circle subtended by the angle.
Materials:

Outline:

  • 3-4 different sizes of circles will be passed out to different pairs of students.
  • Students will use the string to measure the radius of the circle (the center of the circle is marked), and cut a piece of string the length of the radius.
  • Starting with a mark on the circumference of the circle, students will measure how many radius lengths it takes to “travel” around the entire circle.
  • A discussion in small groups, then as a class, will clarify/ensure that all students found that around 6 to 6.5 radius lengths covers the entire circumference (the class average can also be calculated if desired to help with the accuracy of measurements).
  • Teacher question, students discuss in small groups: “what do you know about the circumference of a circle? How does this connect to what you just did?”
  • The connections between the circumference formula being 2πr, 2π ≈ 6.3, 6.3 being close to the number of radii they found that it takes to travel around the circumference, and r (from the equation) literally representing the radius of the circle are desired to be made
  • A discussion about measuring angles in degrees versus radians will ensue, specifically regarding the concept behind degrees and radians (i.e. what is a radian? What is a degree? Degrees are a made-up measurement! Benefits/drawbacks of using each to measure angles).

Assessment:  For an exit ticket, homework, or entry ticket the next day, ask students to write a headline that includes the connections they saw during this activity regarding the terms:  radian, circle, arc length, pi, radius, angle

What components of CONCEPT-BASED CURRICULUM AND INSTRUCTION play out in your post?
This lesson gives students the opportunity to create their own generalizations, hopefully aligning with a few of the generalizations set out for the unit, after exploring the concept of radian measure.  The students are literally constructing what radian measure means by measuring the radius of a circle and connecting this to central angles.
There are facts that students are asked to know:
definitions of radian, arc length
formulas for the circumference of a circle
There are concepts that students are asked to understand:
Radians measure angles by relating the radius of a circle to the arc length of a central angle.
An angle that measures one radian has an arc length of one radius.
There are skills that students are asked to be able to do:
Calculate radian measure of an angle.
Convert angles from degrees to radians and vice versa.

Spaghetti Graphs
Overview:  In this lesson, students will make connections between calculating the sine, cosine, and tangent values for a right triangle and how this directly relates to the graphs of functions f(x) = sin x and f(x) = cos x.
Prior Knowledge Needed/When to Teach:

  • radian measure
  • how to calculate sine and cosine for a triangle
  • familiar with unit circle and positive/negative reference angles

Timing:  2-3 days
Standards:
F-TF.A.3  Use special triangles to determine the values of sine, cosine, tangent for pi/3, pi/4, pi/6, and use the unit circle to express the values of sine, cosine, and tangent for x, pi+x, 2pi-x in terms of their values for x, where x is any real number.
Materials:

Outline:

  • Pull up this Geogebra sketch that shows students an animation of how the graphs of sine, cosine, and tangent connect to the unit circle.
    • Give students 2-3 minutes to individually write down what they SEE.
    • Give students 2-3 minutes to individually write down what they THINK.
    • Give students 1-2 minutes to individually write down what they WONDER.
  • In pairs, give students 3 minutes to discuss what they wrote down. Each pair of students will pick out one comment for each category to write on the butcher paper in the front of the room.
    • Discuss as needed (any comments that will drive the activity, questions that stand out, etc.).
  • Students work in pairs with a full-page unit circle (with reference points), two pieces of full page graph paper, and multiple Pull-n-Peel Twizzler strands.
  • Explain the purpose of the activity: we want to understand where the graphs of f(x) = sin x and f(x) = cos x come from, and how they relate to triangles
  • Discuss/review in small groups (teacher prompts given in questions and parentheses)
    • the measurement units of the axes on the graph paper and what they represent
    • connections between the graph paper and the unit circle (units, measurements, sine/cosine/triangles)
    • how drawing special right triangles in different places in/on the unit circle changes what is being assumed/measured
    • plot multiple/enough points on the sine/cosine graph to create an accurate picture (how many points is enough?)
    • What to do about triangles that are “upside-down” on the unit circle? (may give negative sine/cosine values)
    • When will negative sine/cosine values be seen on the unit circle?
  • Together, label the axes on the sine and cosine graphs in both radians and angles, referencing the “Radian String” lesson as much as possible.
  • Students draw a special right triangle on the unit circle, using one of the reference points given, with a segment drawn vertically down to the x-axis, and a segment drawn straight from the reference point to the center of the circle.
  • Using that triangle, they determine the sine (or cosine) of that central angle (hypotenuse is 1 since it is a unit circle, so the sine (or cosine) is simply the length of the opposite (or adjacent) side length to the central angle).
  • Students will break off a piece of Twizzler that matches the length of the side length for sine (or cosine).
  • This piece of Twizzler is then used to mark the sine (or cosine) value of the angle on the corresponding x = θ line of the graph, where θ is the central angle that was used to draw the triangle.
  • This process is repeated all the way around the unit circle (students should start to see patterns/repetition in the measurements, so they may not actually need to draw/measure each individual triangle/angle).
  • The resulting graphs (should) give a sketch of the sine and cosine curves.
  • Review the See, Think, Wonder comments from the beginning of the lesson. Students discuss what they learned, questions that were answered, thoughts/assumptions that were correct, etc.

Assessment:
Students will respond to two journaling prompts:
How does the unit circle help us understand the graphs of f(x) = sin x and f(x) = cos x?
How do triangles help us understand the graphs of f(x) = sin x and f(x) = cos x?
Notes to Teacher:

  • It may be helpful to pre-peel the Twizzlers in order to reduce waste and too much snacking 😊

What components of CONCEPT-BASED CURRICULUM AND INSTRUCTION play out in your post?
This lesson provides students with the opportunity to see, experience, and build the graphs of sine and cosine using special right triangles and the unit circle.
There are facts that students are asked to know:
Unit circle values (sine, cosine, tangent of various angles)
Identify the graphs of sine and cosine
There are concepts that students are asked to understand:
Special right triangles (30-60-90 and 45-45-90) with hypotenuse length 1 can be used with the unit circle to represent various central angle measures around the circle.
Special right triangles in the unit circle give the (x,y) coordinate points of f(x) = sin x and f(x) = cos x, where x corresponds to the central angle and y corresponds to the sine or cosine value of that angle.
There are skills that students are asked to be able to do:
Geometrically portray the sine or cosine value of any angle on the unit circle.
Accurately sketch the graphs of sine and cosine.

For more information search Pinterest, TeachersPayTeachers, or Twitter (using hashtags) for:  trigonometry graphs, trig graphs, radians, unit circle

Posted in Concept-Based | Tagged , , , , , , , , | 8 Comments

Concept-Based Lesson Plan_Altieri

Data Displays and Measurements

Standards:

Data Representations Lesson 1 (Algebra 1)

Unit Title: Data Representations – Can Data Displays Impact Understanding?

Lesson Time Frame: 3 Class Periods

Lesson Opening (communicate to students at lesson onset):   Data displays are used everyday in the media! We may not realize how often we see data displays used every day.  Data displays are used by news outlets, advertisements and marketing, and social media to represent sample data and inform or sway audience members.

In this lesson, we will be analyzing various data displays and what conclusions we can make from the analysis.  We will also be finding new data displays from media sources and try to draw conclusions based on analysis.  Understanding how data displays can influence an audience is important for becoming critical thinkers in the real-world.  At the end of the lesson, students will be able to break apart data displays, identify patterns and trends, draw conclusions, and make predictions about an entire population.

Learning Targets: What students will Understand (Generalizations), Know (Factual Content), and Be able to Do (Skills):

Generalization(s)

Students will understand that…

  1. There are various types of data displays and ways to represent data.  Guiding Questions:
  • What type of data displays exist? (F)
  • What characteristics of a data set can influence the chosen data display? (C)
  • How do media and marketing outlets use different data displays to influence populations? (D)
  • Why are different types of data displays created? (C)

2. Varying data displays can be analyzed using statistical understanding .  Guiding Questions:

  • What measures of statistics can we use to help analyze data/data displays? (F)
  • How do we compute and calculate measures of statistics from given data sets/displays? (F)
  • Can all statistical measures be found for any given data display?/How can we determine which measures can be found given any data display? (C)
  • What story can data displays and measures help to tell about samples or populations? (D)
  • How can we use data displays and statistical measures to draw conclusions about data sets? (C)
  • How can we make predictions about a population given any data display? (D)
  • To what extent should we (as citizens) analyze data displays that are presented in the news and other media outlets. (D)


Note: the guiding questions above are sorted into:


  • Factual (F)
  • Conceptual (C)
  • Debatable (D)


Components of CONCEPT-BASED CURRICULUM AND INSTRUCTION that play out in this lesson:

This lesson gives students the opportunity to analyze and interpret data displays and make connections to data displays used by media outlets.

There are facts that students are asked to know:  Types of data displays and data measures, and formulas for the data measurements (mean, median, mode, range, etc.)

There are concepts that students are asked to understand:  Various characteristics of a data set can lend themselves to given data displays and representations, and data displays may be chosen to influence and sway audience members.

There are skills that students are asked to be able to do:  Analyze and interpret data displays, draw conclusions based on data displays, and make predictions about a population based on a data display from a sample of that population.


Strand Critical Content (Know) Key Skills (Able to Do)
Data Displays
  • Types of Data Displays (box and whisker plots, histograms, stem and leaf plots, etc.)
  • Analyze various Data Displays (key aspects of each data display)
  • Predict data for an entire population based on how sample data is represented.
Statistical Measurements
  • Definitions of various statistical measurements (mean, median, mode, range, IQR, quartiles, variance, standard deviation, etc.)
  • Calculate statistical measurements to better understand data displays.
  • Align measurements to the displays to make predictions about a population or future data trends.


Learning Experiences Differentiations
Review the importance of statistics: Watch youtube videos that emphasizes the importance of understanding data and data displays.


https://youtu.be/wV0Ks7aS7YI

https://youtu.be/u06BXgWbGvA

Discussion on the videos supplemented by worksheets for student reflection.

Worksheet 1

Practice identifying types of data displays and what types of statistical measurements we can calculate.  Discuss what the data displays predict about an entire population, and the types of bias that can be lurking in data displays and measurements.

To help students better understand biased data displays they can watch this video: https://www.youtube.com/watch?v=ETbc8GIhfHo

Worksheets with different levels of scaffolding.

Worksheet 2

Students work in small groups to analyze data displays from media and news outlets (each group will have a different type of display) and present their findings to the class. Mixed ability grouping.

Worksheet 3

Students find find other data representations and determine if they are bias or misleading and share their results with the class. Provide resources to students. Allow for individual brainstorming and collaboration with peers.  Teacher guidance throughout process.


Materials/Resources:

Youtube Videos (posted below and linked above within lesson plan)

Student Worksheets (linked above)

Data Displays from Media Sources (within worksheet 3 linked above)

Resources for students to explore other data displays:


Assessments:

  1. Formative assessment: observe students’ collaborative engagement and response to open-ended teacher prompting.  
  2. Observe students’ accuracy in analyzing data displays and statistical calculations.
  3. Assign individual student reflection at end of lesson where students discuss (a) Explain what you learned during this lesson and how the visual aids, collaboration with your peers, and teacher guidance supported your learning; and (b) Reflect on your analysis techniques and discuss how you will use what you learned to be a better critical thinker when it comes to data displays in the news and other marketing or media outlets.   

Extension:  What other data displays do you notice in the real-world can you keep track of them and how they may impact the intended audience?


Closing:

Data sets are diverse in nature and data displays are created with the intent to provide a visual representation to a given audience.  As critical thinkers and global citizens, we need to be aware of types of data displays, understand how to analyze them, and draw statistical conclusions based on our analysis.


Teacher Notes:

This lesson is part of a unit on statistical analysis and data representations. The real-world connections and inquiry processes result in a high level of interest among students.  The use of news outlets, social media, and other online data resources also sustains interest.  The discussions on the impact of data on an audience can be linked to key life skills (critical thinking) for global citizens.


Data Representations Lesson 2 (Algebra 1)

Unit Title: Data Representations – Let’s Build!

Lesson Time Frame: 2 Class Periods

Lesson Opening (communicate to students at lesson onset):  Data displays are used to easily communicate data to an audience!  We may not realize how data impacts our everyday lives (from what we buy, and look at on the internet, to the music played on the radio, and even iPhone sales).  There is a lot of data that students may find interesting.

In this lesson, we will be choosing a data set (or collecting our own data) and creating an appropriate data display.  We will also be defending our reasoning behind choosing the data display for the given set of data (for example a box-and-whisker plot may be chosen when outliers exist within the data).  At the end of the lesson, students will be able to share their created displays, explain their reasoning behind their created data display, and present their ideas and findings to their peers.


Learning Targets: What students will Understand (Generalizations), Know (Factual Content), and Be able to Do (Skills):

Generalization(s):

Students will understand that…

  1. There are various characteristics within a data set that align with appropriate data displays.  Guiding Questions:
  • What key data measurements can we find from a data set? (F)
  • What characteristics are important when creating a data display? (F)
  • How do we choose what type of data display to use? (C)

2. There are key features in a data set that must be incorporated into a data display.  Guiding Questions:

  • What key features exist in data sets that also must be incorporated into data displays? (F)
  • How do we create clear and organized data displays? (C)
  • What types of information should always be included in a data display? (C)
  • What story can data displays and measures help to tell about samples or populations? (D)
  • How can we use data displays and statistical measures to draw conclusions about data sets? (C)
  • How can we make predictions about a population given any data display? (D)

Note: the guiding questions above are sorted into:


  • Factual (F)
  • Conceptual (C)
  • Debatable (D)


Components of CONCEPT-BASED CURRICULUM AND INSTRUCTION that play out in this lesson:

This lesson gives students the opportunity to mathematically analyze a set of data and create their own data displays to reflect their findings.

There are facts that students are asked to know:  Types of data displays and data measures, and formulas for the data measurements (mean, median, mode, range, etc.)

There are concepts that students are asked to understand:  Various characteristics of a data set can lend themselves to given data displays and representations, and data displays may be chosen to influence and sway audience members.

There are skills that students are asked to be able to do:  Analyze and interpret data sets, create various data displays, defend reasoning behind created data display.


Strand Critical Content (Know) Key Skills (Able to Do)
Data Displays
  • Types of Data Displays (box and whisker plots, histograms, stem and leaf plots, etc.)
  • Create a data display that is clear to a viewer and reflects a chosen data set.
  • Predict how a data display reflects an entire population.
Statistical Measurements
  • Definitions of various statistical measurements (mean, median, mode, range, IQR, quartiles, variance, standard deviation, etc.)
  • Determine what statistical measures must be apparent in a data display.
  • Make connections between a data display and the statistical measures of the data set.


Learning Experiences Differentiations
Review how to create data displays and the tools available for creating data displays (box-and-whisker plot generator, google sheets and forms for data collection and displays, associated applets. Discussion of creating data displays.
Practice creating data displays given a set of data.  Students will work in small groups. Worksheets with different levels of scaffolding.

Worksheet 1

Students work in small groups to find interesting data (such as iPhone sales) or collect their own data (using google forms or surveys). Mixed ability grouping.  Provide resources to students.
Students determine what type of data display to create based on their found or collected data.  And construct their models.   Allow for individual brainstorming and collaboration with peers.  Teacher guidance throughout process.


Materials/Resources:

Student Practice Worksheets (linked above)

Data Sets and tools for collecting data (statistics websites)

Resources for students to help create data displays


Assessments:

  1. Formative assessment: observe students’ collaborative engagement and response to open-ended teacher prompting.  
  2. Observe students’ accuracy in analyzing data sets and choosing appropriate data displays.
  3. Students present their data displays to the class.  Before discussing their findings, other students can volunteer to analyze the presented data display (linking back to the first lesson).  Students then discuss their found or collected data and defend the reasoning behind choosing their type of display.  Students will be able to see if their own interpretations line up with the group’s motives for choosing the given data display.  Students answer questions from their peers.

Extension:  What broad conclusions can be made about the relationships between data sets and data displays?


Closing:

Data sets are diverse in nature and data displays are created with the intent to provide a visual representation to a given audience.  As critical thinkers we need to know how to create various types of data displays, understand how to analyze displays, and draw statistical conclusions based on analysis of displays.


Teacher Notes:

This lesson is part of a unit on statistical analysis and data representations. The real-world connections and inquiry processes result in a high level of interest among students.  Allowing students to find their own data set or collect their own data also sustains interest.  Asking students to share their findings and reasoning with their peers encourages accountability for their work.

Posted in Concept-Based | Tagged , , , , , | 14 Comments

Bradford – CBCI Lesson Plan

Area and Perimeter of Quadrilaterals and Triangles

Conceptual Lens: Geometry

Time Allocation: 3-4 Days

Grade: 7th; taught as a review of 6th grade content

Unit Overview:  Area and perimeter are used all of the time in real life – from finding the square footage of flooring needed to cover a space, to finding the amount of fencing needed to enclose an area.  So how do we find the area and perimeter of shapes other than rectangles?  How would we find the area and perimeter of new shapes from the formula for the area of a rectangle?

Unit Strands:Knowing Vocabulary,Understanding Formula for Perimeter, Understanding Formulas for Area, Calculating Perimeter, Calculating Area

Concepts in the Unit:

  • Quadrilateral, rectangle, parallelogram, trapezoid, triangle, irregular figure
  • Perimeter of polygons and irregular figures
  • Area of Rectangles, Triangles, Parallelograms, Trapezoids, and Irregular Figures
  • Distance, Length, Width, Base, Height, Right Angle

Critical Content: What I would like students to know

  • Know geometric vocabulary: Length, width, base, height, parallelogram, trapezoid, triangle, area, perimeter.
  • The height of a figure is not always vertical, but rather intersects the base(s) at a right angle.

Key Skills: What I would like the students to be able to do:

  • Identify the base(s) and height of a figure.
  • Explain how the area and perimeter of triangles, parallelograms, trapezoids, and irregular figures relate to the area of a rectangle.
  • Find the area and perimeter of rectangles, triangles, parallelograms, and trapezoids.
  • Find the area and perimeter of irregular figures.

Generalizations: What I would like students to understand:

  • The area of a rectangle can be found by multiplying the length and width, or base and height.
  • The area of triangles, parallelograms, trapezoids, and irregular figures can be found using the formula for the area of a rectangle.
  • The area of a triangle can be found by multiplying the base and height, and dividing by two.
  • The area of a parallelogram can be found by multiplying the base and height.
  • The area of a trapezoid can be found by averaging the bases and multiplying by the height.
  • The formulas for the area and perimeter of quadrilaterals and triangles can be extended to find the area of irregular figures with non-curved sides.
  • The formulas for area and perimeter can be used often in real life.

Guiding Questions (F: Factual, C: Conceptual, D: Debatable)

  • What do the following words mean? Length, width, base, height, parallelogram, trapezoid, triangle, area, perimeter (F)
  • What are the formulas for the area of a rectangle? (F)
  • How do we find perimeter of any figure? (F)
  • How are parallelograms, triangles, and trapezoids similar to rectangles? How are they different?  What measurements do they have in common? (C)
  • How does the area of a rectangle relate to the area of parallelograms, triangles, and trapezoids?  (C)
  • How could we adapt our formula for the area of a rectangle to find the area of parallelograms, triangles, and trapezoids? (C)
  • What is the formula for the area of parallelograms, triangles, and trapezoids? (F)
  • If we can find the area of parallelograms, triangles, and trapezoids from the area of rectangles, is it still worth knowing their individual formulas? (D)
  • How could we use the area of rectangles, parallelograms, triangles, and trapezoids to find the area of irregular figures? (C)
  • Should we make up a formula for finding the area of different types of irregular figures? (D)
  • How could we use area and perimeter formulas in real life? (C)

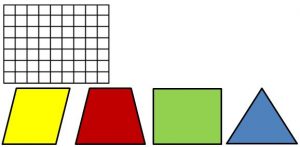
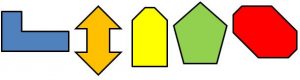
Assessment:

  • What: Students will investigate area and perimeter of polygons
  • Why: In order to understand the relationship between the area of polygons and the area specifically of rectangles, and to find the area and perimeter of various types of figures with straight edges.
  • How: The assessment will be composed of the following pieces.
    • Identify types of figures and their area formulas.
    • Explain how the area of parallelograms, triangles, and trapezoids relate to rectangles.
    • Find the area of given rectangles, parallelograms, triangles, and trapezoids.
    • Find the area of irregular figures.  Explain how they found these areas.

Unit Outline:

Day 1:

Lesson Objectives: The student will be able to recall vocabulary and determine formulas related to the perimeter and area of polygons.  This lesson is intended for 7th graders as a review of area and perimeter.

Prior Knowledge: Because this is a review of previous material, students come into class understanding how to find area and perimeter of rectangles, and remembering small pieces of how to find the area of parallelograms, triangles, and trapezoids.  However, they often times do not have a conceptual of finding area of triangles and quadrilaterals.

Standards:

Materials Needed:

  • Opening Handout (See step 1 below)
  • Grid and Polygons (See step 4 below)
  • Projector and/or White Board (Teacher)
  • Pencil and Paper (Student)

Lesson Outline:

  1. Opening Activity/Recall: Students will be given a handout with images of different types of three and four-sided figures. Their job is to (1) name each figure, (2) explain why they know it is that type of figure, (3) label the important vocabulary on the figure (ex: length, width, base, height). An example of this handout is given below:

  • Here is an entertaining video talking about types of figures that could be used to reteach types of figures.
  1. Determining a definition of area and perimeter: I will ask students to answer the following questions on their opening handout. After answering these questions on their own, students will discuss their answers with the class.  As students respond, I will record student responses on the board.
    • What is area?
    • What is perimeter?
    • Why are area and perimeter useful?
  1. Defining area and perimeter for rectangles: I will ask students to answer the following questions on their opening handout. After answering these questions on their own, students will discuss their answers with their group, and then with the class as a whole.  As students respond, I will record student responses on the board.
    • How do we find the area of a rectangle? Draw a picture showing what is meant by finding area.
    • How do we find the perimeter of a rectangle? Draw a picture showing what is meant by finding perimeter.
    • Note: Prior to whole-class discussion, I will circulate the room to get an idea of student responses.  During whole-group discussion, I will highlight certain student’s work and will ask students questions such as “What do you think about this?” “Why do you think they draw this picture to represent area?”
  1. Relating area of parallelograms, triangles, and trapezoids to area of rectangles: For the remainder of this lesson, students will be working in a group to determine the areas of parallelograms, triangles and trapezoids. Students will be given handouts to walk through the different parts of the lesson.   Students will also be given a large grid, and a rectangle, parallelogram, trapezoid, and triangle that could fit on the grid.  All the four figures have the same base and height, although the top base of the trapezoid has a different height.  Reduced images of what they will be given are shown below.


  1. Examining the parallelogram, trapezoid, and triangle: I will explain to students that their goal is to come up with a rule for how they could find the area of parallelograms, triangles and trapezoids.  I will project the following questions for students to think about on their own and then discuss with their group to help them discover the formulas for each figure.
    • Place the figure on the grid, and look at how it sits on the grid.  What do you notice
    • How is the figure similar to a rectangle when it is on the grid? How is it different?  What could you do to the rectangle to make it like a rectangle?
    • Make an estimate of the area of the figure.  How did you do this?
    • What does this tell us about finding the area of the figure?
    • What could be our formula for finding the area of the figure?
  1. Class discussion: Once students have time to come up with their “rules” or formulas for finding area of parallelograms, triangles, and trapezoids, we will discuss their findings as a class. During whole group discussion, the class will come to conclusions about the formulas for each of the shapes.  They will be asked to then record their formulas.
    • Note: Prior to whole-class discussion, I will circulate the room to get an idea of student responses.  During whole-group discussion, I will highlight certain student’s work and will ask students questions such as “What did you notice about the space that each figure took up on the grid?” “What do you think about this solution?” “How did you come up with this rule?” “Do you think this formula would work for any triangle [or parallelogram or trapezoid], or just the one you had?”
  1. Reflection: At the end of the lesson, have students reflect upon their learning by answering the following questions. Once they have their answers written down, have students share their responses with the class.  If there is time, discuss the last question as a class.
    • What did you learn today about area and perimeter of figures?
    • What are you still confused about from today’s lesson?
    • If we can find the area of parallelograms, triangles, and trapezoids from the area of rectangles, is it still worth knowing their individual formulas?
  1. Formative Assessment: The teacher class use classroom observations, discussions, and students’ written reflections from part (6) to gauge student understanding.
  2. Reteach: If students would like to see how we came up with our formulas again, they can access the following videos:
  1. Extension/Homework: Ask students to respond to the following problems:
    • Look at the perimeter and area of the shapes you used to find your formulas. Are perimeter and area proportional for all of the figures?  How do you know?
    • If area and perimeter are not proportional, think about what would make a quadrilateral have a bigger area for a set perimeter (that means each shape has the same perimeter, but may have a different area). Draw pictures to come up with a solution.

Day 2: Area and Perimeter Practice: Students will be given the following types of questions: (1) questions relating area of polygons back to the area of a rectangle, (2) basic practice, (3) real life examples, and (3) “problem solving” examples (may include variables to extend student thinking).

Day 3: Irregular Figures

Standards:

Materials Needed:

  • Irregular Figures (See step 2 below)
  • Projector and/or White Board (Teacher)
  • Pencil and Paper (Student)
  • Scissors and Rulers (Students)

Lesson Outline:

  1. Introduction: I will introduce the lesson by saying, “So far, we have seen how we find the area of parallelograms, rectangles, triangles, and trapezoids. But shapes in real life aren’t always so nice.  Look at our classroom, for example.  The floor is not a perfect rectangle.  If I was replacing the tile in class, I wouldn’t be able to just multiply the length and width.  Today, we are going to explore how we find the area and perimeter of figures that don’t look as nice as what we’ve seen so far.”
  2. I will give students several cut-out irregular figures, as seen below.

  1. Students will be completing “See, Think, Wonder.” I will write the following questions on the board.
    • See: What do you see looking at these figures? (I will have students record their responses on paper, and then share with a partner.)
    • Think: What do you think is true about these figures? (I will have students record their responses on paper, and then share with a partner.)
    • Wonder: What do you wonder about find the area and perimeter of these figures? (I will have students record their responses on paper, and then share with a partner.)
  1. Discussion: Discuss as a class what the students noticed during “See, Think, Wonder.” Record what they wrote on the board, and then come to a conclusion together about how they might find the area and perimeter of irregular figures.
  2. Practice: Have students work with a partner to break the irregular figures into smaller shapes, and then find the combined areas. Students are welcome to use scissors to cut shapes, and should use rulers to measure their figures in centimeters.
  3. Share: Once students have completed the task, have pairs of students share their responses with the class. Pairs of students can then compare their findings with other pairs.  (If a document camera is available, students can project their work for the class to see.  Otherwise, students can draw their images on the board.)There are many different ways to break up irregular figures, so this will give students a chance to understand that there are multiple approaches to solving problems.
  4. Wrapping Up: Have students record answers to the following questions. Once they have finished, discuss the second question as a class.
    • How did you use the area of rectangles, parallelograms, triangles, and trapezoids to find the area of irregular figures?
    • Should we make up unique formulas for finding the area of different types of irregular figures? Why or why not?
  1. Formative assessment: The teacher class use classroom observations, discussions, and students’ written reflections from part (6) to gauge student understanding.
  2. Reteach: If students would like additional help, they can watch this video.

Day 4: Summative Assessment (See section titled “Assessment” above.)

Posted in Concept-Based | Tagged , , , , , , , , | 15 Comments

MTV Strategies – Burtis

This blog is about starting, finishing, and the thinking involved in each. It contains two lessons plans utilizing MTV strategies. One is an introductory lesson for an Algebra 3 class, while the other is a review session for an Algebra 2 class. They can be adapted to many other Algebra topics. The two strategies I chose are Chalk Talk for the start and Generate-Sort-Convert-Elaborate: Concept Mapping for the finish.


Lesson 1: Chalk Talk: Review of Functions (Algebra 3)

Overview: Units 2 and 3 will include operations and extensions of functions that were originally introduced in Algebra 2. This lesson is designed to take 2 days to give the students the opportunity to tap into prior knowledge about what they remember and understand from Algebra 2 before tackling new processes with the functions. It will also serve as a pre-assessment to allow the teacher to adjust and adapt the subsequent review lessons to ensure that all students have the same base of knowledge before tackling the new concepts. Getting the students up and sharing is a bonus. This could possibly be done in one class period, depending on the length of the periods. I chose to do it in two periods to allow for more conversation and discussion. Day 1 will be done whole class, which is a slight adaptation, while Day 2 will be done as a station exercise, which is how Chalk Talk is normally presented.

Goal: To help the students recall the different functions studied in Algebra 2, as well as what their graphs look like, how to graph them, some of the specific properties of the different functions, and how they are related.  Note to teacher: deficiencies or confusion in any of these areas will inform my next few “review” lessons.


Standards: While there are multiple standards addressed in the original instruction of the various functions, no specific standards fit the review process.


Materials: Day 1 – A white board or chalk board and lots of dry erase markers or chalk                             Day 2 – Chart paper (4-6 pieces) and markers
Day 1: (This is a slight adaptation: While conventional strategy has Chalk Talk as a silent, stations activity, this will be whole class and involve a lot of discussion…hopefully.) In the middle of the white board will be the prompt: “FUNCTIONS IN ALGEBRA”.  Direct their attention to the white board and ask them “What comes to mind when you think about FUNCTIONS as it relates to Algebra?” Remind them that they are to think back to the things they were taught in Algebra 1 and 2.

  • Give them a few minutes to think about it, then have the students go to the board and write down a word, idea, phrase, or picture that comes to mind. All students will go to the board. Have them go up in groups of 5 or 6 so no one feels put on the spot being the only person up there. They can put their input anywhere on the board.
  • After everyone has put something up, then start a discussion about what each one means.
  • Some sample questions include: Do any tie together? If they do, how are they related? Are all the different functions you learned in Algebra 2 up there? Which ones are missing? What do the functions look like? Hopefully this will generate more ideas. As they come up, you can have the students go up and add them to the board, or the teacher can do it.
  • Ideas I am hoping show up, and will prompt myself if not, include: families of functions, graphs and making them, domain and range, and solving functions.
  • Wrap up the day by picking 5-6 topics or ideas. Ask the students to write those chosen on a blank sheet of paper. For homework, think of two or three things about each topic. It can be something they know that relates or maybe a question they may have about it.
  • Tell them that a picture of their creation will be posted on their Google Classroom site for them to look at if they choose.

Hopefully, the white board will look something like this, with a lot less empty spaces by the time your discussion is completed.

Day 2: The room will be set up with 5-6 tables spread out with chart paper on each one that represents the topics chosen on Day 1.

  • This time the Chalk Talk will be silent. Put them in groups, just to facilitate moving around the room.
  • They are to visit each station and write down an idea or question relating to the topic. It will remain anonymous, so hopefully no one will be uncomfortable participating.
  • There will be multiple markers at each station. This should be completed in 15-20 minutes.

Once everyone has circulated through the room, place each chart paper on the white board and discuss each one individually. If the class was thorough on Day 1, some ideas will not be new. That is okay, as long as the connection is there.  Note to teacher: Make sure you have some questions for each topic to move the discussion along should it bog down. Remember this is a pre-assessment. Students will formally review these topics over the next few days, so specific processes can/will be discussed then. You are looking for connections and understanding so you can gauge the level of review needed.

Assessment: Since this is a review/introductory lesson, there will be no summative assessment. The homework between Day 1 and Day 2 will be used as a formative assessment, as well as a participation component. Note to teacher: if a summative assessment is desired, one possibility is to have the student pick a topic and write a paragraph or two detailing what they learned about the topic from the 2 day process.


Social Media:

Below are a couple YouTube videos showing Chalk Talk in action (in different subjects):

https://www.youtube.com/watch?v=3Q2eeaYKCmY

https://www.youtube.com/watch?v=xpxAaT3h70M&t=8s

https://www.youtube.com/watch?v=knhen8U6h68

Below are a couple links to blogs or articles on Chalk Talk through the Pinterest web site:

http://visiblethinkingroutines.blogspot.com.au/2013/05/chalk-talk.html

http://langwitches.org/blog/2014/05/11/visible-thinking-routine-in-action-chalk-talk/

https://literacylove.com/2013/10/10/making-thinking-visible-1-chalk-talks/


Lesson 2: Generate-Sort-Convert-Elaborate; Concept Maps – Solving Quadratic                                                    Functions Review (Algebra 2 B)


Overview: The chapter on Quadratic Equations and Functions is one of our longer and more difficult chapters. There is a lot of material.  Modeling, properties, graphing, translations, factoring (multiple types), completing the square, the discriminant, and the quadratic formula all come in to play, and it can get a bit overwhelming for the students. There is one part of the unit where we discuss solving quadratics by various means, and this lesson is meant as a review/wrap-up of that section, prior to a short assessment on it. I plan on it taking two days.

Goal: To have students prepare a Concept Map to help them organize their thinking when it comes to solving quadratic equations. Over the past several days we discussed several methods they can use to solve them, and the goals is to help them organize their thinking about the different methods and when to use them. Teacher note: While we may know what we would hope is on each map, what each student thinks important or helpful will vary, so expect a wide variety of detail.

Standards: While they are not being taught a single specific standard in this lesson, there are several that they have been exposed to over the past several days that are part of this review:

A-CED.A.2: I can graph quadratic functions written in standard form.

A-SSE.A.2: I can find common and binomial factors of quadratic expressions. I can factor special quadratic expressions.

A-CED.A.1: I can solve quadratic equations by factoring. I can solve quadratic equations by graphing.

A-REI.B.4b: I can solve quadratic equations by completing the square. I can solve quadratic equations by the quadratic formula.


Materials: Small and medium sized post-it notes, large sheet of paper (preferably at least 11 x 14), writing utensil.

General Information:

  • I will allow them to work in groups of three or four, but each student will be responsible for producing his own concept map. The exercise will conclude with a homework assignment after day 2 that is their quiz review, and they will be encouraged to use their completed concept map to assist them where needed.
  • The Post-It notes are so they can write things down, decide on the size used by the importance of the idea, and move things around as they decide on the linkage to other items and processes.
  • The finished product may include the post it notes (taped or glued in place) or they may transfer the ideas and links to the paper directly once their final decisions are made.

Day 1: I will have introduced concept maps to them earlier, but once all the material distributed and groups formed, I will review the idea of a concept map with them. Ideally, we will have done them earlier in the year and they will be able to refer to their own product as reference. Then we will begin:

  1. Generate: They will take a piece of paper and list all the major and minor ideas they can think of as it relates to the unit on solving quadratics. Since this is a review, I will give them about 10 minutes to work together. They will have access to their notes should they wish to use them. After 10 minutes, we will have a 5-minute discussion where they will share what they have listed. Teacher note: this discussion is optional, but since this is a B class and not college prep I feel it’s important that the discussion happen so anyone who might have missed a day or two, or does not have good notes is not left out.
  2. Sort: They will then transfer the ideas on their lists to post-it notes so they can do the sort process. Discussion in the group should be about the relative importance of each idea, which are the main topics and which are support ideas. This will allow them to use respective sizes of post-it notes to reflect that. They should also be deciding which ideas go together, placing them on their paper with the important, or main ideas in the middle and lesser or connected ones on the outside. Again, while the decisions and process are as a group, each individual is responsible for his own product. They DO NOT have to do it all the same.

I believe the first two steps will consume all of the period, so cut them off with enough time to clean up and store their work. If any are not done with the sorting phase, they finish that up as homework.

Day 2: Get the students back into their groups of four, remind them what they did during first two steps, and then move into step 3.

  1. Connect: This is the point where the students will solidify where each Post-it should go, and then connect them by drawing lines to connect ideas and process that should go together. Any ideas that need branching out should be so indicated by lines also.
  2. Elaborate: Have the students pick one or two of the ideas, ideally one that has given them problems, and write a few notes on the paper to help them solve that problem or issue. Make sure the elaboration is along the connecting line to the problem area. If they need to access their notes to do so, that is fine. Teacher note: remember that these are supposed to be somewhat personal to each student’s needs, so this is one area where they may deviate from others in the group. Encourage some initiative here for personalizing it to their needs.
  3. Share: (while not a segment listed in the title, a vital part of the process) Once they are finished with their concept map, I will have them pair up with someone who was not in their group and exchange maps. Encourage them to talk to their new partner to find out what they may have done different, and why. Suggest they take notes on the differences in case they may want to alter their own later. I will them have them switch one more time and compare notes again.

As wrap-up, they may make any adjustments to their concept maps, based on their discussion during the Share portion, during the remainder of class. If needed, they may finish up as homework and turn in at the start of class the next day.

Assessment: Since each student is responsible for producing their own Concept Map, this will serve as the assessment piece. I plan to allow them to use their Concept Map as a resource on the next days quiz. They will submit it with their completed quiz at the end of the next class period.

Social media:

Below are several links to the GSCE:CM routine and Concept Maps on YouTube:

https://www.youtube.com/watch?v=DCnuRtdTGWM

https://www.youtube.com/watch?v=IwqxAJpxrnk&t=22s

https://www.youtube.com/watch?v=vuBLI6ijHHg

https://www.youtube.com/watch?v=bQlgx5biqCQ

Below are several links to the GSCE:CM routine and Concept maps from Pinterest:

http://making-teaching-visible.blogspot.com/2014/05/generate-sort-connect-elaborate.html

http://visiblethinkingroutines.blogspot.com.au/search/label/Generate-%20Sort%20-%20Connect%20-%20Elaborate

Posted in Making Thinking Visible, Misc | Tagged , , , , , | 14 Comments

MTV Strategies – Markham

*Lesson 1: Introduction to Quadrilaterals (What makes you say that?)

Objective: The purpose is to have students identify the key aspects of various types of quadrilaterals.  By varying the quadrilaterals used for the activity, this lesson can be used with students as young as 3rd or 4th grade up through a high school Geometry class.  For the purpose of this blog, I will tailor it to 10th grade Geometry class.

Timing:  Approximately 45 minutes (can be completed in one class period) with a follow up assessment the next class.

Materials: Pictures of various types of quadrilaterals, including a general quadrilateral, rectangle, square, trapezoid, parallelogram, kite, rhombus.  Clipboards or other hard surface students can use to write on during Gallery Walk.

Process:

  1. Introduce students to the Thinking Routine “What makes you say that?”  by posting the pictures of the quadrilateral, rectangle, and square at the front of the classroom.  Students will be familiar with these shapes from previous math classes.  Explain that we are reviewing these shapes as an introduction to the Thinking Routine, “What makes you say that?” and ask students to take a few minutes to jot down some observations about each shape.  Students can draw on their prior knowledge of these shapes or just what they can conclude from the pictures.
  2. Begin a group discussion by having students share some of their observations.  As observations are provided, record them on or around the picture with which they are associated.  Ask the student the follow-up question “What makes you say that?”  Open the question to the class for additional/alternative answers.
  3. Once students have a feel for listing observations and also asking themselves why they can make that observation, split students into small groups of 3-4.  Place the pictures of trapezoids, parallelograms, kites, and rhombuses around the room to create a Gallery Walk.  (See The Teacher Toolkit for an introduction to Gallery Walks if you are not familiar. http://www.theteachertoolkit.com/index.php/tool/gallery-walk)  Have students spend 2-3 minutes at each picture, making observations about what they see.  Let students know they will, once again, be asked “What makes you say that?” for their observations.  Groups should start practicing their justifications while noting their observations.
  4. Repeat step 2, taking observations from groups this time.

Assessment: To start the next class, hand students a quadrilateral as they enter the classroom.  Ask students to classify the quadrilateral based off the observations they made last class.

Social Media: This Quadrilaterals Song is a parody of a popular Imagine Dragons song that students will likely recognize.  Use it as an opener or closer on the first day, or have it playing while students are classifying their quadrilateral on Day 2.


Lesson 2: Normal Distribution (Headlines)

Objective: Conclude an introduction to the Normal Distribution with the Headlines Thinking Routine to help students focus on key aspects of the distribution.  This could be used with a high school statistics class or functions and modeling class.

Timing: 15 minutes at the close of class, with an informal assessment at the start of the next class.

Materials: Markers and paper

Process: Use an activity of your choice to introduce students to the Normal Distribution.  For example, this popcorn activity from the American Statistical Association.  After the lesson, ask students to write a headline that might appear in a newspaper about the Normal Distribution.  It could be a key feature, a tip for using the distribution, etc.  Give them a couple minutes to work independently, then ask students to share their headlines with a neighbor or two.  As a small group, refine the headlines as needed and then write them on paper to be posted around the room.

Assessment:  In the next class period, supply students with a practice problem that utilizes the Normal Distribution.  Ask students to work independently or with a neighbor to solve the problem, using the headlines as a reminder of the important aspects.  After reviewing the problem, ask students “Which headlines were most useful?”  “Are there any you would like to refine or modify?”

Posted in Making Thinking Visible | Tagged , , | 64 Comments