Lesson 1: Team Building Activity – Variation of “It’s a Mystery”
| Lesson Objective | This goal of this lesson is to help students learn to work together as a team, to learn to communicate, and to learn to problem solve together. These are all integral components to cooperative learning in mathematics. |
| Lesson Overview | This lesson would take place upon assigning students new cooperative learning groups. First, students will discuss what successful teamwork looks like, and will then complete a team building activity in the form of “It’s a Mystery.” http://www.teachthought.com/critical-thinking/10-team-building-games-that-promote-critical-thinking/ Following the team building task, students will reflect upon working collaboratively. |
| Room Set-Up | To encourage team work and to provide a space for the tasks, desks will be put into groups of 4. Students will come to the big tables in the back of the room to get the new supplies for each task. |
| Materials Needed |
|
| Outline | 1.Introduction: I will say, “Today you have been placed into teams with students you will be working with for the next few weeks of class.”
2. Team Building Activity: Students will be trying to find a missing object from my classroom. The students will be completing four problem solving tasks as a team to find the missing object. Upon completing each task, students will see me to check if they completed it successfully, and then I will give them a clue. Therefore, altogether, they can receive four clues. *Each task is designed to include problem solving and interdependence. Some tasks require each member to take a specific role. Other tasks are challenging in nature, which encourages students to seek one another for help. *
3. Reflection:
|
Lesson 2: Collecting and Analyzing Data (Jigsaw 2, revised)
| Lesson Objective | Students will understand how to collect, analyze, and compare real world data. |
| Standards | CCSS.MATH.CONTENT.7.SP.A.1 Understand that statistics can be used to gain information about a population by examining a sample of the population; generalizations about a population from a sample are valid only if the sample is representative of that population. Understand that random sampling tends to produce representative samples and support valid inferences.
CCSS.MATH.CONTENT.7.SP.A.2 Use data from a random sample to draw inferences about a population with an unknown characteristic of interest. Generate multiple samples (or simulated samples) of the same size to gauge the variation in estimates or predictions. For example, estimate the mean word length in a book by randomly sampling words from the book; predict the winner of a school election based on randomly sampled survey data. Gauge how far off the estimate or prediction might be. Draw informal comparative inferences about two populations. CCSS.MATH.CONTENT.7.SP.B.3 Informally assess the degree of visual overlap of two numerical data distributions with similar variabilities, measuring the difference between the centers by expressing it as a multiple of a measure of variability. For example, the mean height of players on the basketball team is 10 cm greater than the mean height of players on the soccer team, about twice the variability (mean absolute deviation) on either team; on a dot plot, the separation between the two distributions of heights is noticeable. CCSS.MATH.CONTENT.7.SP.B.4 Use measures of center and measures of variability for numerical data from random samples to draw informal comparative inferences about two populations. For example, decide whether the words in a chapter of a seventh-grade science book are generally longer than the words in a chapter of a fourth-grade science book. |
| Prior Knowledge | This lesson is intended for a 7th grade advanced math class. Many students in my 7th grade advanced math class are familiar with different displays of data, but do not fully understand how to collect and analyze real world data. This lesson is intended to students better understand data collection, and the ways they can use it in everyday life. |
| Lesson Overview |
|
| Room Set-Up | To encourage team work and to provide a space for the tasks, desks will be put into groups. While students work with their “Expert Groups,” desks will be in sets of 6. While students work with their regular teams, desks will be in sets of 4. |
| Materials Needed |
|
| Outline | 1. Introduction: I will begin the lesson by letting students know that they will be spending the next several days working with their teams, as well as “Expert Groups” in class. I will remind discuss with them what group work looks like, and the importance of interdependence and respect.
2. Choosing Topics: Students will begin in groups of 5. Each group member will choose one topic in the data and stats unit to become an expert on: (1) Population and Sample (Includes vocabulary, types of samples, and identifying bias) (2) Mean, Median, Mode, Range, and Outliers (3) Box and Whisker Plots (4) Histograms and Bar Graphs (5) Comparing Data Using Variability and Measures of Center 3. Learning with Expert Groups: Students will move into “Expert Groups” to learn about their topics and plan lessons. For each topic, students will have videos to watch, practices, and a culminating quiz. All quizzes will be given on Schoology to give students immediate feedback. Some of the resources for these groups can be seen below. However, since the quizzes are on Schoology, they are unable to be linked. (1) Population and Sample (2) Mean, Median, Mode, Range, and Outliers
(3) Box and Whisker Plots (4) Histograms and Bar Graphs
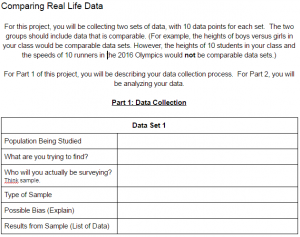
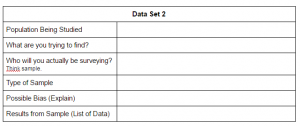
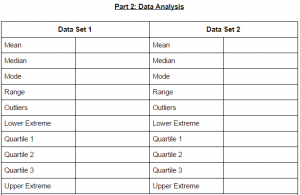
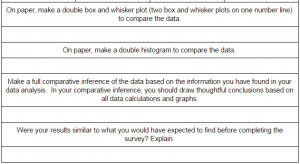
(5) Comparing Data Using Variability and Measures of Center 4. Planning Mini-Lessons: Once students have learned about their topic, they will plan an interactive mini-lesson with their expert groups to teach their original groups about the topic. 5. Teaching Mini-Lessons: Students will rejoin their original group to complete mini lessons. The group members will share their lessons in the order seen above. 6. Data Collection and Analysis Project: Following the mini-lessons, each group will be completing a data collection and analysis project. In the project, the students will be asked to: (1) Collect two sets of comparable data from the rest of the class or school on a topic that interests them. (2) Find measures of center and measures of variability for the data. (3) Create a double histogram or double bar graph of the data. (4) Create a double box and whisker plot of the data. (5) Analyze the data. An image of the student project page can be seen below.
7. Reflection:
|
| Assessment | Formative Assessments:
Summative Assessment:
|


This does interest me
I really enjoy examining on this internet site , it has got great posts .
I consider something really special in this site.
very Great post, i actually love this web site, carry on it
This helps. Cheers!
very interesting post, i actually love this web site, carry on it
I like this website its a master peace ! Glad I found this on google .
I truly enjoy looking through on this web site , it holds superb content .
I conceive you have mentioned some very interesting details , appreciate it for the post.
This does interest me
I am glad to be one of the visitors on this great website (:, appreciate it for posting .
Hey, google lead me here, keep up nice work.
Intresting, will come back here again.
Good Day, glad that i found on this in yahoo. Thanks!
This is great!
I was looking at some of your articles on this site and I believe this internet site is really instructive! Keep on posting .
I will introduce the Bootstrap grid system, address a few of Bootstrap’s built-in classes, work with Bootstrap’s tabbed navigation, and provide examples of blending your own CSS with Bootstrap.
Cheap Jerseys League
Draft of the same year on the bottom rookie will be what?In general the draft should be able to blow the other party, who would have thought them took Owen on the 60th pick small Thomas in the same year, he turned out to be in the position of the challenger?
curry 4
Layup is a very basic basketball skills maybe everyone layup but there is a way of layup is not everyone that is wrong step layup.
stephen curry jersey
Sales, Coupons, and DiscountsActive online stores work hard at driving sales through various promotions.
Cheap Basketball Jerseys
But the first thing I want to look at is, what are the sales numbers.
Wholesale Jerseys Free Shipping
“I don’t think eastern conference finals will be a long war, knight’s strength is too strong. The celtics nobody with lebron, they even Owen this level of star all have no, they are really no one can stop the knight.
adidas boost
I have observed that service fees for on-line degree pros tend to be an excellent value. For example a full Bachelor’s Degree in Communication from The University of Phoenix Online consists of Sixty credits at $515/credit or $30,900. Also American Intercontinental University Online makes available Bachelors of Business Administration with a total study course feature of 180 units and a tuition fee of $30,560. Online studying has made getting the college diploma far more easy because you can easily earn your degree through the comfort of your dwelling place and when you finish from office. Thanks for all tips I have really learned through the site.
stephen curry shoes
Aside from maintaining a clean customer database, the tool allows us to test and compare split messages, conduct segmented campaigns, encourage viral spread with forward-to-a-friend functionality, stay in compliance with CAN-SPAM and of course measure, measure, measure.
Cheap NFL Jerseys
Middle of the pack 14) New York Giants 15) Pittsburgh Steelers 16) Tampa Bay Buccaneers 17) Chicago Bears 18) Miami Dolphins 19) New York Jets 20) Indianapolis Colts 21) Atlanta Falcons 22) San Diego Chargers 23) Buffalo Bills The Giants’ preseason isn’t about rookie receiver Sterling Shepard vs.
Wholesale NFL Jerseys Online
Bradford – Cooperative Learning Lessons | EDT 622
lblzhyimr http://www.g80v2f4y4wt390y2wng8z645jn1eo5d6s.org/
alblzhyimr
[url=http://www.g80v2f4y4wt390y2wng8z645jn1eo5d6s.org/]ulblzhyimr[/url]
Stephanie,
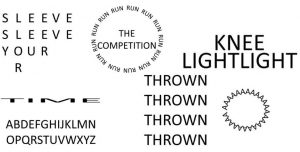
I love all of the changes that you made since your original discussion post. I think your students will truly benefit from your lessons. I really love the types of activities that you engage students in during task 2 of the first lesson. Below is a link to other similar calligrams. It could be interesting at some point in this lesson (or future lessons) to have students create their own calligrams using math concepts.
https://digitalsynopsis.com/design/hidden-meaning-logos-word-as-image-calligrams/
Thanks, Audrey. I like those calligrams that you found; they seem a little more challenging than the ones I found, which could be more beneficial for students working in groups! Also, that is a great idea for students to create their own calligrams using math concepts. Creating their own could be really engaging for them, and would give them a chance to review their math vocabulary.
Thanks Cory! I am hopeful that the activities will help students to work together. Thanks for the website that shows students how they could use data analysis to a career; this would help to answer students’ question of “How am I going to use this in real life?”
I love your team building activity! It has students problem solve together in multiple levels of thinking. With four different tasks, you can bring out strengths of different members of them team. Someone might have a strength in the toothpick activity, while another might find more success with the hula hoop challenge. This will allow for different members to step up and take a leadership role. Really like it!
Here is some funny videos you could show your students of hula hoop challenges
https://www.youtube.com/watch?v=9MN6GNhvwzA
Also you might find this interesting on the topic of analyzing data, giving students a concept of doing this for a career
http://www.payscale.com/research/US/Job=Data_Analyst/Salary