
Unit Title: Linear Relationships: What will happen next?
Subject: Algebra I
Lesson Opening: You’ve already learned all of the building blocks of linear functions. We’ve worked with at least three different ways to represent linear relationships and have a strong understanding of how each of those relationships work together. Now we’re going to use all of that information to make predictions based on linear patterns. If you know what happens in one day, can you use that to predict what will happen in a week, a month, a year? When patterns are linear, they are consistent. Therefore we can use what we know to predict the future. In this unit, we will be looking at situations and data that may or may not have linear behavior. It will be up to you to analyze the data and determine what is happening in a situation based on the mathematics you observe. By the end of the unit, you will be able to identify if there are linear relationships with a data set and how to use linear relationships to predict what would happen in the future.
Learning Targets:
- Students will understand how to identify linear relationships from data
Guiding Questions:
- What makes a relationship linear? (F)
- How can a linear relationship be represented? (F)
- Where are the slope and y-intercept represented in the data? (C)
2. Students will understand ways to use linear relationships to predict future occurrences.
Guiding Questions:
- How can this relationship be used to predict what happens next? (C)
- Does that hold true for all future occurrences? (D)
- How can you be sure? (D)
Strand:
Expressing Linear Functions with Representations:
Critical Content (know): definition of slope, y-intercept, x-intercept, and coordinates on the plane
Key Skills (Able To Do): Identify slope and y-intercept from data, can represent data in various forms (graphs, tables, etc) and can generalize data using an equation in any linear form.
Use Linear Models to Predict Future Occurrences:
Critical Content (Know): standard form, slope intercept form and point slope form of linear functions
Key Skills (Able To Do): Analyze data to determine linear relationships, create linear models from data, extend linear models past given data (future predictions)
Lesson Objective: Students know that linear relationships can be expressed using a table, graph, equation and are familiar with verbal descriptions of all three representations. This unit will extend that knowledge such that students will be able to identify a relationship as linear, represent it in a variety of ways and use those representations to make future predictions.
Learning Experience One:
Lesson Timing: This task is designed for three 45 minute class periods. The first class period will be allotted for introducing the unit, small group work with the task and beginning the first discussion over what students observed. The second class period will be provide time for students to finish the first discussion and begin the second part of the activity. The third class period will provide time for students to share their questions and solutions and look for other possible pathways to solve the questions posed.
Standards:
CCSS.MATH.CONTENT.HSA.CED.A1: I CAN create equations in one variable and use them to solve problems
CCSS.MATH.CONTENT.HSA.CED.A.3: I CAN represent restrains of equations and determine if solutions are valid for those restrains.
CCSS.MATH.CONTENT.HSF.LE.A.1 I CAN identify situations that can be represented by linear functions
CCSS.MATH.CONTENT.HSF.LE.A.1.A: I CAN prove that linear functions grow by equal differences.
Learning Experience:
Students will be given the following scenario after the unit has been introduced:
Scenario (Day 1):
You are working as a lifeguard at a pool over the summer. At the beginning of the summer, you have to fill the pools with water. When you get to work, you notice that someone forgot to drain the pool from last summer. You now have to fill the empty pool with water and drain the full pool so that you can put in fresh water for the summer. Each pool holds 600 gallons of water. Luckily, a fellow lifeguard arrived earlier and began to fill the empty pool, but only filled the pool with 150 gallons of water. You start to drain and fill the two pools respectively at the time time. 2 hours later, you check both of the pools. The pool that started with 150 gallons of water now has 250 gallons of water. The pool that started with 600 gallons of water now has 500 gallons of water. 3 hours later, you check the pools again and the pool that is filling now has 400 gallons of water and the pool that is draining now has 350 gallons of water.
With your group, examine the scenario and answer the following:
- What questions do you have about the scenario?
- What types of inferences do you think you can draw from the scenario?
- Can you make any mathematical observations from the information given?
- If you could have more information, what information would you like and why.
Record your findings, questions and ideas in a way that makes sense to you and your group.
Discussion(Day 1 – Day 2):
To begin the discussion, each group will get a large post it paper and write down their questions, observations and representations. Each of these will be put up in the front of the class to display each group’s thought process. Students will have a few moments to read through the other group’s findings. As a class, there will be a discussion that follows about the inferences students made, what mathematical observations they recorded, the questions that they had and the extra information they wanted but did not have.
After the discussion, the students are asked (Day 2 – Day 3):
What would some logical questions be to this scenario and how could you solve them?
With their groups, students will formulate possible questions (ie: When will the pools have the same amount of water? How long will it take to fill the pool? How long will it take to drain the pool? If the pools were smaller or larger, how would that affect the time it takes to fill and drain the pools? etc.) and solutions to their questions.
Discussion 2 (Day 3):
Students will present their questions and solutions to the class and a second discussion will follow regarding the questions students formulated and if there are other possible questions and/or ways to solve the questions posed.
Differentiation: For students working at varying levels within the same classroom, groups can be created as heterogenous groups so that there is a high achieving student, average achieving student and low achieving student within the same group. This will allow for all students to see various perspectives on the scenario based on different observations and background knowledge. Students who receive accommodations per IEPs or 504 plans will be granted those accommodations.
Assessment: Students will be formatively assessed based on their group work, participation in discussions and ability to connect the data to the idea of linearity and at least one linear representation. Students will be provided a rubric that outlines the expectations for participation and mathematical connections.
Materials:
- Scenario
- Large post-it paper
- Markers to record on post-it paper
- Graph paper if students would like to use it for representations
Teacher Notes: For this lesson it will be tempting to jump in and lead students to the idea of comparing the amount of water and the amount of time. Refrain from guiding students too much through the activity including pointing to various representations of linear functions (graphs, tables, equations, etc). Allow students to investigate the scenario on their own to make genuine connections to the mathematical concepts being examined.
Learning Experience Two:
Lesson Objective: For this lesson, students will continually be building on their knowledge of linear functions. Students will be researching and analyzing data to find linear relationships between variables in a way that can be used to make future predictions. Students will be extending their knowledge by asking questions that can be answered via data analysis and by making predictions based on the data.
Lesson Timing: This task is designed for two 45 minute class periods. The first class period will be allotted for student research on data and discussion within the small group to analyze the data. The second class period will be allowing students to present their data and get feedback from their peers as outlined in the lesson outline.
Standards:
CCSS.MATH.CONTENT.HSA.REI.B.3: I CAN solve linear equations with variable coefficients.
CCSS.MATH.CONTENT.HSA.CED.A.1: I CAN create equations in one variable and use them to solve problems
CCSS.MATH.PRACTICE.MP3: I CAN make arguments from data and analyze the claims of others.
Learning Experience:
Prompt(Day 1): As you reflect on daily occurrences that surround you, ideas that interest you or activities you participate in, ask yourself, “Do the variables that make up this circumstance have a linear relationship?”
This may not be obvious at first and that is okay!
With your group, brainstorm possible situations that have variables with linear relationships. Once your group has decided on a situation, research that situation to find data on the variables you have chosen. Analyze the data you have found and determine if a linear relationship exists. As you analyze the data, look for other mathematical patterns as well and think about the following questions:
- What types of inferences do you think you can draw from the data you have collected?
- Are there other mathematical patterns within the data? Can you model those patterns? What types of relationships do these patterns show?
- If you could have more information, what information would you like and why.
- What mathematical questions can you formulate that you might use this data to answer?
Example: Brody and Joey love basketball and are interested in the average height of basketball players over the years as they dream to play in the NBA one day. They decide that they want to analyze data that includes the average height and weight for NBA players since 1951. Brody and Joey collect the following data:
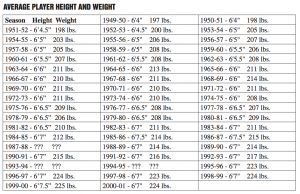
The boys will now analyze this data and create mathematical questions that may be solved from the data.
Discussion(Day 2):
Each group will present their findings to the class. The class will discuss the findings and questions for that group in terms of what they found interesting, if anyone sees additional patterns, what other data could have supported their claim, etc. After each group has presented their data, the other groups will be given a few moments (5-10) to design a question they would want to try to answer based on the presented data. These questions can be as broad or as narrow as students choose to cover content knowledge (writing an equation) as well as extending their knowledge (looking for other patterns or influences in the data). Students will submit their groups questions at the end of the class period
Differentiation: Students will be in heterogenous groups that have mixed interests and ability levels. This is to ensure that students are exposed to varying mathematical ideas and levels both in and outside of the classroom. Students who need guided instruction will be given specific scenarios that have linear relationships, but will remain in charge of finding data, interpreting the data and arriving at the conclusion that the data shows a linear relationship. Students who receive accommodations per IEPs or 504 plans will be granted those accommodations.
Assessment: The questions that students created from their peer’s presentations will be used as assessment questions as there will be multiple different outlooks on linear relationships. Students will be given 2 – 3 questions and the supporting data to assess if they achieved the goal of understanding how to identify linear relationships from data and ways to use linear relationships to predict future occurrences.
Post Lesson: After the lesson, this video can be used to give students more examples of linear relationships and their connections to prior knowledge. Into to Linear Functions
Materials:
- Computer access for data research
- Paper and writing utensil to record student data, questions, observations, etc
- Graph paper if students choose to represent their data graphically
Teacher Notes: This is a very open activity with many opportunities for students to make strong educational choices. While it may be difficult not to give specific parameters, it is important to let students make the choices about what data is important to collect and analyze. A great deal of the understanding in this unit is to choose variables that may have linear relationships. If students are choosing variables that clearly will not have linear relationships, this should act as a red flag and the teacher can intervene with questions about what it means to be linear and have linear relationships without directing students to specific data or scenarios.
While working through the CBCI unit, I found it much more in depth than the MTV section. This website helped me reason though some of the ideas behind CBCI and has some interesting posts.
The NBA playoffs now for today, have determined the warriors in the western conference and will compete for a spot in the finals quota, knight still don’t know who his opponent was.However, even in the face of the celtics or the wizards, presumably knight will be
vans shoes
According to The Fear of The Sword, The knight’s point guard deron Williams is a fan of MMA (mixed), compared to The basketball game, deron prefer to watch The ultimate fighting championship.Deron Williams recently said in an interview, he retired from the NBA
nike hyperdunk
According to The Fear of The Sword, The knight’s point guard deron Williams is a fan of MMA (mixed), compared to The basketball game, deron prefer to watch The ultimate fighting championship.Deron Williams recently said in an interview, he retired from the NBA
nike zoom vaporfly
With three points to beat John wall, the day before yesterday the wizards will competition into the tiebreak wars, 8:00 tomorrow the wizards will be tie-break at Celtic and rival.
nike zoom vaporfly elite
Yesterday, the wall on the right side 45 live a miserable life in the three points must win.The shooting location is Owen puts up the location of the many times.Today was asked Owen saw wall dead there is what feeling
kyrie 1
According to The Fear of The Sword, The knight’s point guard deron Williams is a fan of MMA (mixed), compared to The basketball game, deron prefer to watch The ultimate fighting championship.Deron Williams recently said in an interview, he retired from the NBA
kyrie 4
Knight finally written pledge to fulfill a military order!Owen Jefferson suspected the contradiction, huang zhan anger: don’t win playoff team and the team retired showdown between the more and more intense, will the rockets in just eliminated the spurs tomorrow will come and warriors in the first fight
adidas clothing
I have mastered some new issues from your web site about computers. Another thing I have always believed is that computer systems have become a product that each home must have for a lot of reasons. They supply you with convenient ways in which to organize homes, pay bills, shop, study, hear music and perhaps watch television shows. An innovative solution to complete many of these tasks has been a laptop computer. These personal computers are mobile, small, highly effective and portable.
For Jordan and gregg popovich comments James never hit back, but just yesterday in the knight’s basketball stadium set aside a James training video, far look like illusions emerged both Owen, a carefully look just know is James
adidas pure boost
I have mastered some essential things through your blog post. One other stuff I would like to say is that there are plenty of games on the market designed in particular for toddler age young children. They involve pattern acknowledgement, colors, dogs, and shapes. These typically focus on familiarization rather than memorization. This keeps children and kids engaged without experiencing like they are studying. Thanks
”PEC: Tell our readers about your company, ChannelAdvisor.
NFL Jerseys Cheap Authentic
The noises and stressful the playoffs.”We are eager to match.”Owen said.Knight should first game will be on Thursday in east, and before them
kyrie 4
CBCI Lesson Plan – Heller | EDT 622
jgkktwymqt http://www.ge9j06j0w8i19x871evto401mj733xqvs.org/
[url=http://www.ge9j06j0w8i19x871evto401mj733xqvs.org/]ujgkktwymqt[/url]
ajgkktwymqt
Wow! What a great intro problem with the swimming pool. I want to be in your class to see what the students do with that. It also reminded me of the water problems that we did on Desmos with MTH 607. Well done! Oh and I just talked about that watermelon example on Christ’s page that you started off your blog with 🙂
Thank you Kristyn! I’m excited to see what students do also!