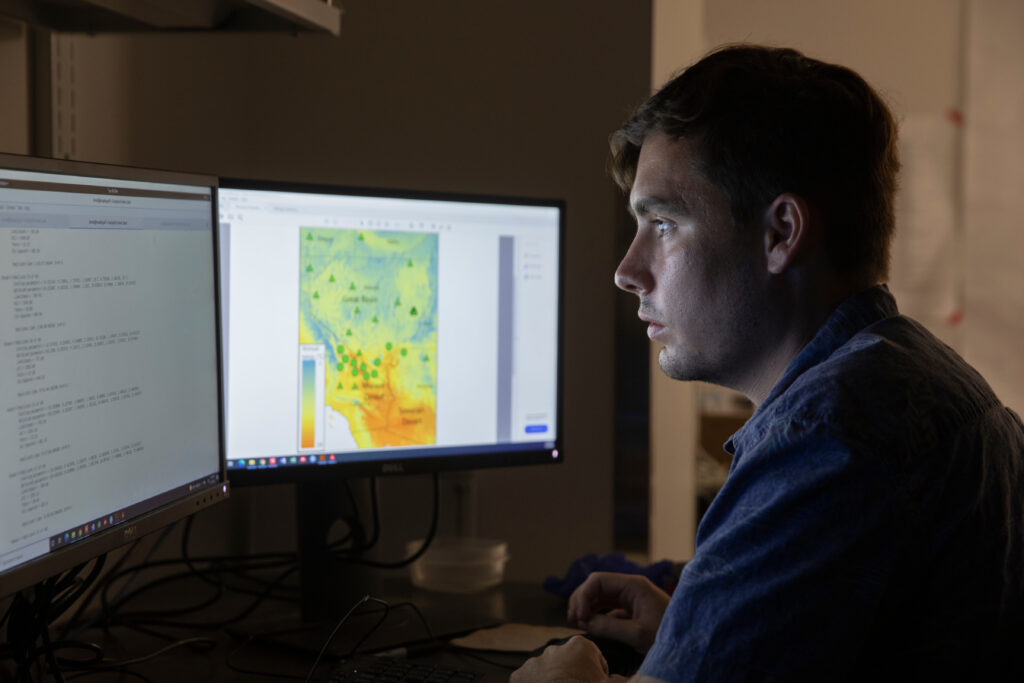

Learn to handle and analyze spatial data with R 
We refer to spatial data as information that can be tied to a given place with coordinates (such as latitude and longitude). This can represent a locality where a certain event occurred, where a species of interest was observed, where a certain measurement was taken, an area were you placed a transect, a set of regions you want to compare, and more. There are many questions being addressed by biologists that have specific geographic components.
In this introductory 4-day course, we will introduce concepts related to the geographic component of biological information, including, but not limited to: how spatial data look like, what common formats are used to store spatial information, how to making simple maps, simple statistical analysis, and how to predict species distributions using real data.
For this purpose, we will use R, a free and common statistical software and programming language widely use as a tool in biology and other sciences. You will learn what R and Rstudio are, how to set up your computer to begin your work, how to read the data you need, and how to perform the tasks mentioned above.
 Data Analysis